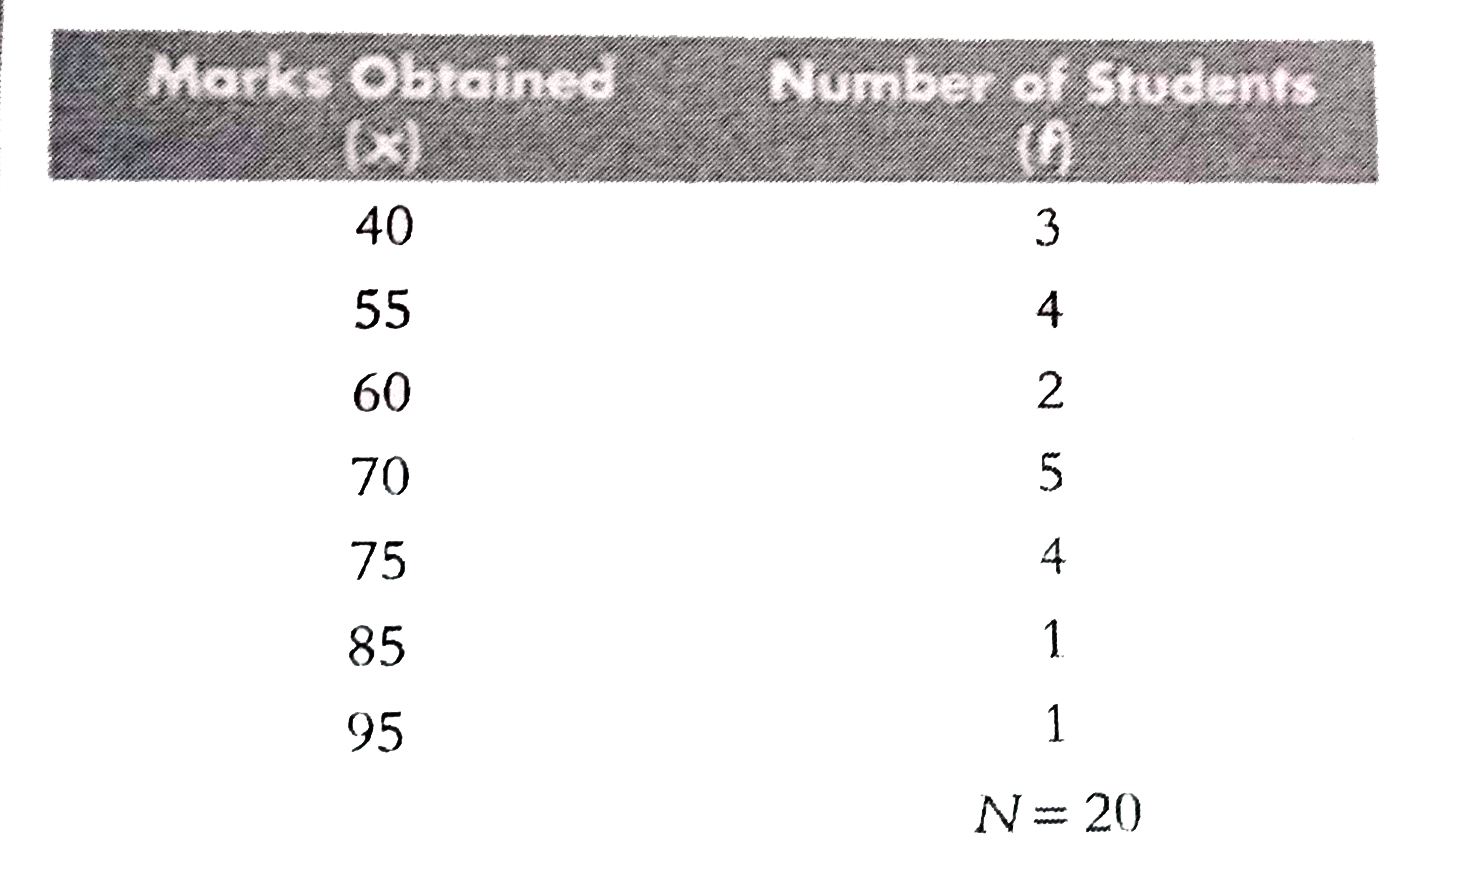
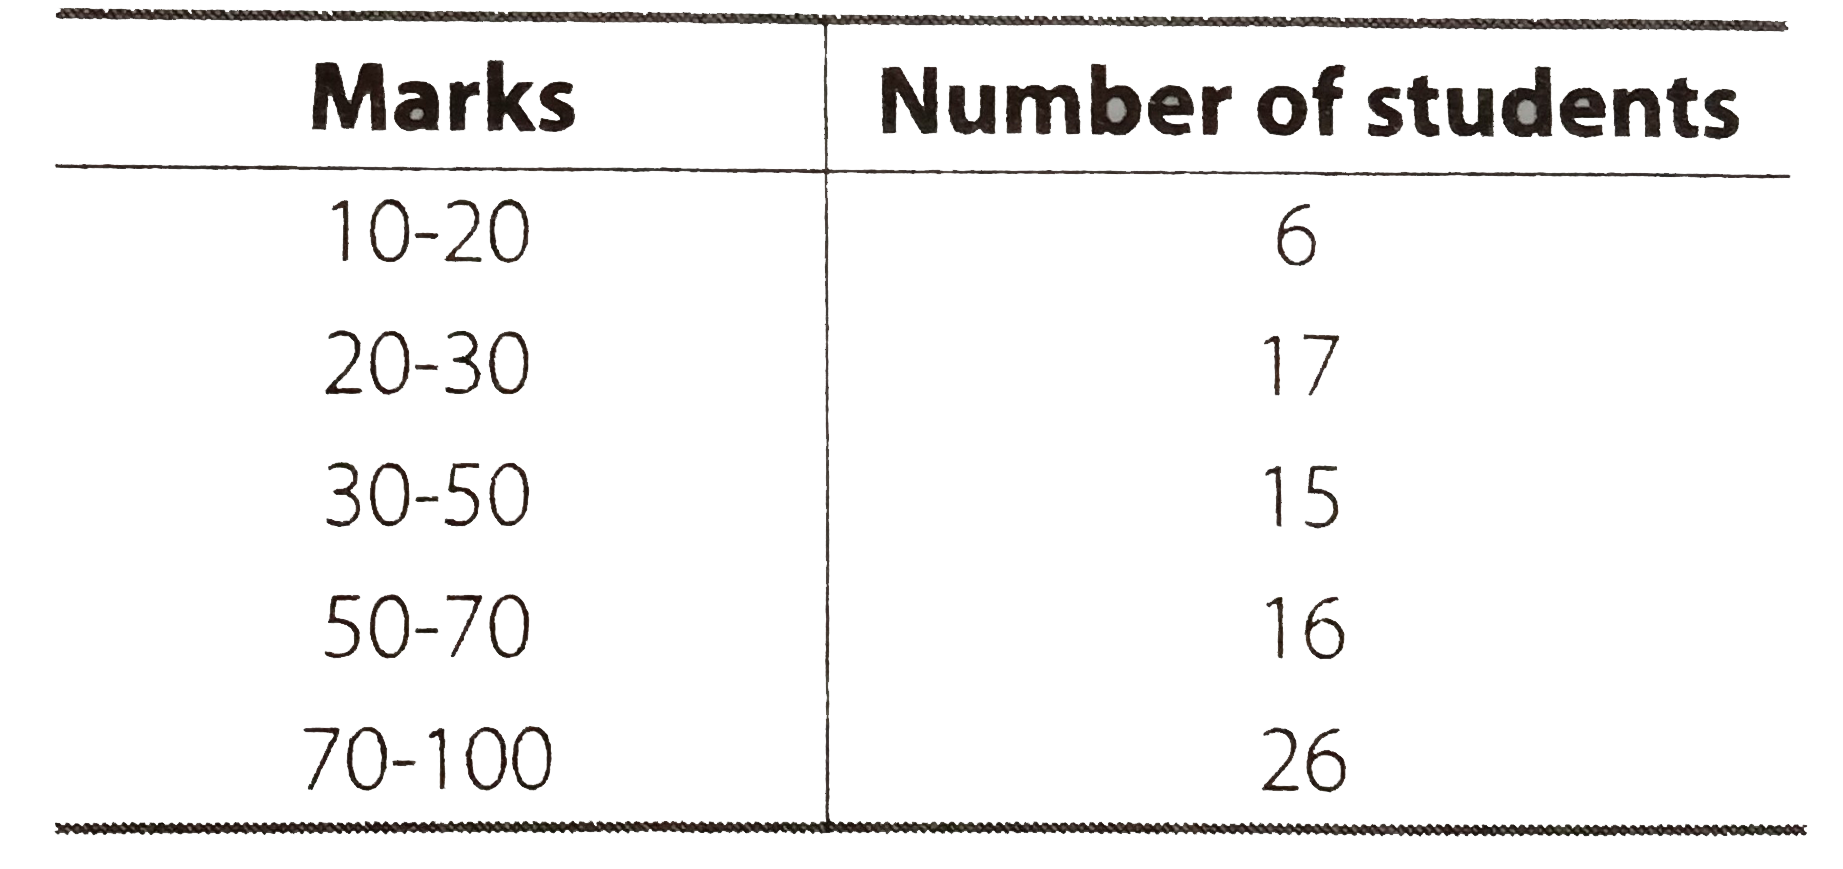
In an annual examination marks (out of 90) obtained by students of Class X in mathematics are given below:

Find the mean marks .
The correct Answer is:55.5
Step by step video & image solution for In an annual examination marks (out of 90) obtained by students of Class X in mathematics are given below: Find the mean marks . by Maths experts to help you in doubts & scoring excellent marks in Class 10 exams.
Updated on:21/07/2023Topper's Solved these Questions
- MEAN,MEDAN,MODE OF GROUPED,DATA CUMULATIVE FREQUENCY GRAPH AND OGIVE Book:RS AGGARWALChapter:MEAN,MEDAN,MODE OF GROUPED,DATA CUMULATIVE FREQUENCY GRAPH AND OGIVE Exercise:EXERCISE 18 B
Explore 14 Videos
- MEAN,MEDAN,MODE OF GROUPED,DATA CUMULATIVE FREQUENCY GRAPH AND OGIVE Book:RS AGGARWALChapter:MEAN,MEDAN,MODE OF GROUPED,DATA CUMULATIVE FREQUENCY GRAPH AND OGIVE Exercise:EXERCISE 18 C
Explore 10 Videos
- MEAN,MEDAN,MODE OF GROUPED,DATA CUMULATIVE FREQUENCY GRAPH AND OGIVE Book:RS AGGARWALChapter:MEAN,MEDAN,MODE OF GROUPED,DATA CUMULATIVE FREQUENCY GRAPH AND OGIVE Exercise:Exercise 18A
Explore 2 Videos
- LINEAR EQUATIONS IN TWO VARIABLES Book:RS AGGARWALChapter:LINEAR EQUATIONS IN TWO VARIABLES Exercise:QUESTION
Explore 2 Videos
- PERIMETER AND AREA OF PLANE FIGURES Book:RS AGGARWALChapter:PERIMETER AND AREA OF PLANE FIGURES Exercise:TEST YOURSELF (SHORT -ANSWER QUESTIONS)
Explore 1 Video
Similar Questions
Knowledge Check
The marks (maximum marks 100) obtained by 20 students in a test are given below :

Find the mean marks of the 20 students.A64B64.5C54D54.5
Marks obtained by 100 students of a class are given below. Find out range and coefficient of range of the marks.

View SolutionThe marks out of 40 scored by 7 students in Mathematics are given below :
40,39,40,37,35,39,40.
Find the medium and the mode of these marks.
View SolutionThe percentage of marks obtained by students of a class in mathematics are: 64, 36, 47, 23, 0, 19, 81, 93, 72, 35, 3, 1. Find their mean.
View SolutionThe marks obtained (out of 100) by a class of 80 students are given below

View SolutionThe mean and standard deviation of marks obtained by 50 students of a class in there subjects, mathematics, physics and chemistry are given below: Subject Mathematics Physics Chemistry Mean 42 32 40.9 Standard Deviation 12 15 20 Which of the three subjects shows the highest variability in marks and which shows the lowest?
View SolutionThe marks (out of 100) obtained by a group of students in Mathematics test are :
88, 74, 90, 88, 40, 46, 58, 96, 82, and 78. Find :
mean marks obtained by the group
View SolutionThe marks (out of 100) obtained by a group of students in Science test are 85, 76, 90, 85, 39, 48, 56, 95, 81 and 75 . Find the
Mean marks obtained by the group
View Solution
