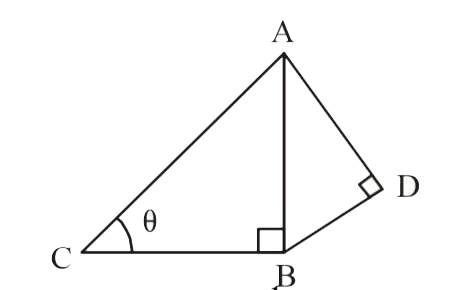
In Fig. if AD = 4cm, BD = 3 cm and CB = 12 cm. then cotθ=

125
512
1312
1213
The correct Answer is:A
Step by step video, text & image solution for In Fig. if AD = 4cm, BD = 3 cm and CB = 12 cm. then cottheta= by Maths experts to help you in doubts & scoring excellent marks in Class 10 exams.
Updated on:21/07/2023Topper's Solved these Questions
- INTRODUCTION TO TRIGONOMETRYBOOK - CBSE COMPLEMENTARY MATERIALCHAPTER - INTRODUCTION TO TRIGONOMETRYEXERCISE - SHORT ANSWER TYPE (I) QUESTIONS
15 Videos
- INTRODUCTION TO TRIGONOMETRYBOOK - CBSE COMPLEMENTARY MATERIALCHAPTER - INTRODUCTION TO TRIGONOMETRYEXERCISE - SHORT ANSWER TYPE QUESTIONS
20 Videos
- CONSTRUCTIONSBOOK - CBSE COMPLEMENTARY MATERIALCHAPTER - CONSTRUCTIONSEXERCISE - (PRACTICE-TEST) SECTION-C
1 Videos
- PAIR OF LINEAR EQUATIONS IN TWO VARIABLESBOOK - CBSE COMPLEMENTARY MATERIALCHAPTER - PAIR OF LINEAR EQUATIONS IN TWO VARIABLESEXERCISE - PRACTICE-TEST (SECTION-D)
1 Videos
Similar Questions
Prove the identities sec4θ−sec2θ=tan4θ+tan2θ
View SolutiontanA+secA−1tanA−secA+1=1+sinAcosA
View SolutionDraw two tangents to a circle of radius 3.5cm from a point P at a distance of 5.5cm from its centre. Measure its length.
View SolutionSolve the following pair of equations graphically.
3x+5y=12 and 3x–5y=–18.
Also shade the region enclosed by these two lines and x-axis.
View SolutionHow many lines of symmetry does the above figure have ?
View SolutionWhich of the following are correct chain isomers of butane ? (i)
View SolutionDetermine the point of symmetry of a regular hexagon.
View SolutionDtermine the images of the following figure about the given line :
View SolutionIn the figure above (not to scale), ¯¯¯¯¯¯AB⊥¯¯¯¯¯¯CDandAD is the bisector of ∠BAE.AB=3cm and AC=5cm. Find CD.
View SolutionIn the following figures, PT=4 cm , TQ=6cm and RT=3 cm , then TS=_______________.
View SolutionMatch the following Column A to Column B

View SolutionMatch the following Column A to Column B

View SolutionMatch the following Column A to Column B

View SolutionThe inequation represented by the graph given below is :
View SolutionThe inequation that best describes the graph given below is _________
View Solution
