In Figure, time and distance graph of a linear motion is given. Two positions of time and distance are recorded as, when T = 0, D = 2 and when T = 3, D = 8. Using die concept of slope, find law of motion, i.e., how distance depends upon time.
Step by step video & image solution for In Figure, time and distance graph of a linear motion is given. Two positions of time and distance are recorded as, when T = 0, D = 2 and when T = 3, D = 8. Using die concept of slope, find law of motion, i.e., how distance depends upon time. by Maths experts to help you in doubts & scoring excellent marks in Class 11 exams.
Updated on:21/07/2023Topper's Solved these Questions
- STRAIGHT LINES BOOK - MODERN PUBLICATIONCHAPTER - STRAIGHT LINES EXERCISE - Exercise 10(a)
10 Videos
- STRAIGHT LINES BOOK - MODERN PUBLICATIONCHAPTER - STRAIGHT LINES EXERCISE - Exercise 10(b)
7 Videos
- STATISTICSBOOK - MODERN PUBLICATIONCHAPTER - STATISTICSEXERCISE - Chapter Test
7 Videos
- TRIGONOMETRYBOOK - MODERN PUBLICATIONCHAPTER - TRIGONOMETRYEXERCISE - Chapter Test (3)
12 Videos
Similar Questions
In figure, time and distance graph of a linear motion is given. Two positions of time and distance recorded and when T=0, D=2 and when T=3, D=8. Using the concept of slope, find law of motion i.e. how distance depends upon time.
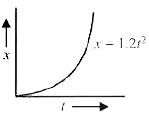
View SolutionGiven figure shows the distance-time graph of the motion of a car. It follows from the,| graph that the car is
View Solution
Knowledge Check
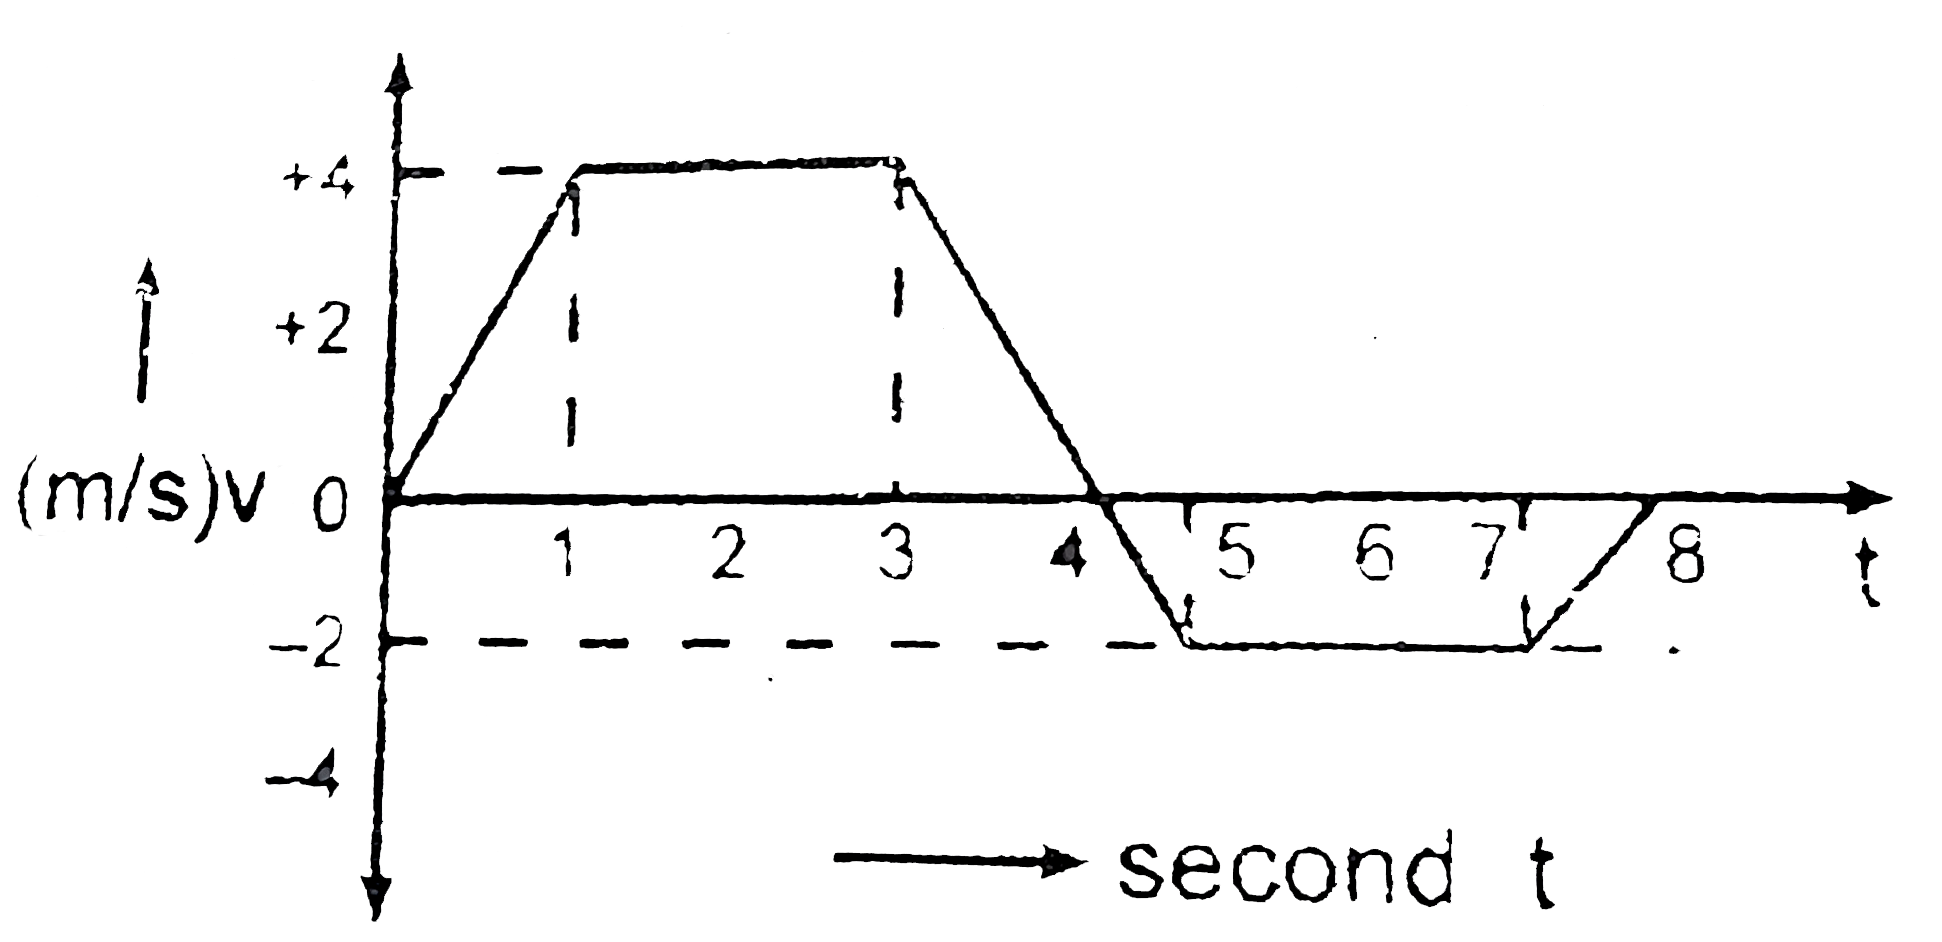
The v-t graph of a linear motion is shown in adjoining figure. The distance from origin after 8 seconds is -
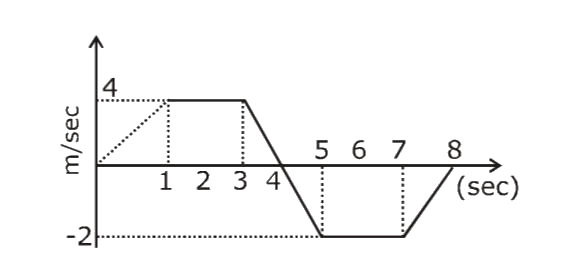 A18 metersB16 metersC8 metersD6 meters
The velocity-time graph of a linear motion is shown below. The distance from the origin after 8 seconds is :
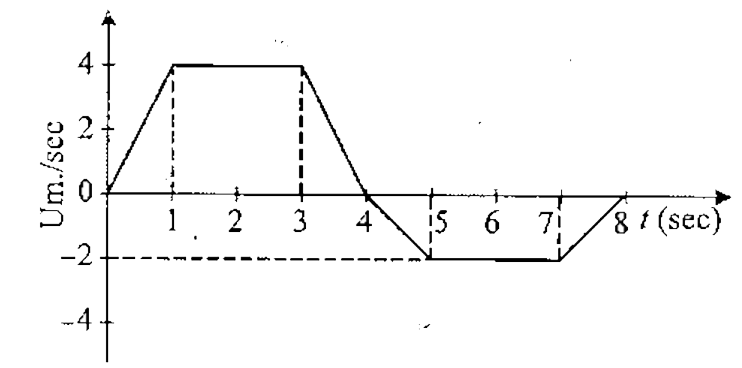 A18 mB16 mC8 mD6 m
The velocity-time graph of a linear motion os shown figure. The distance from the starting point after 8sec is.
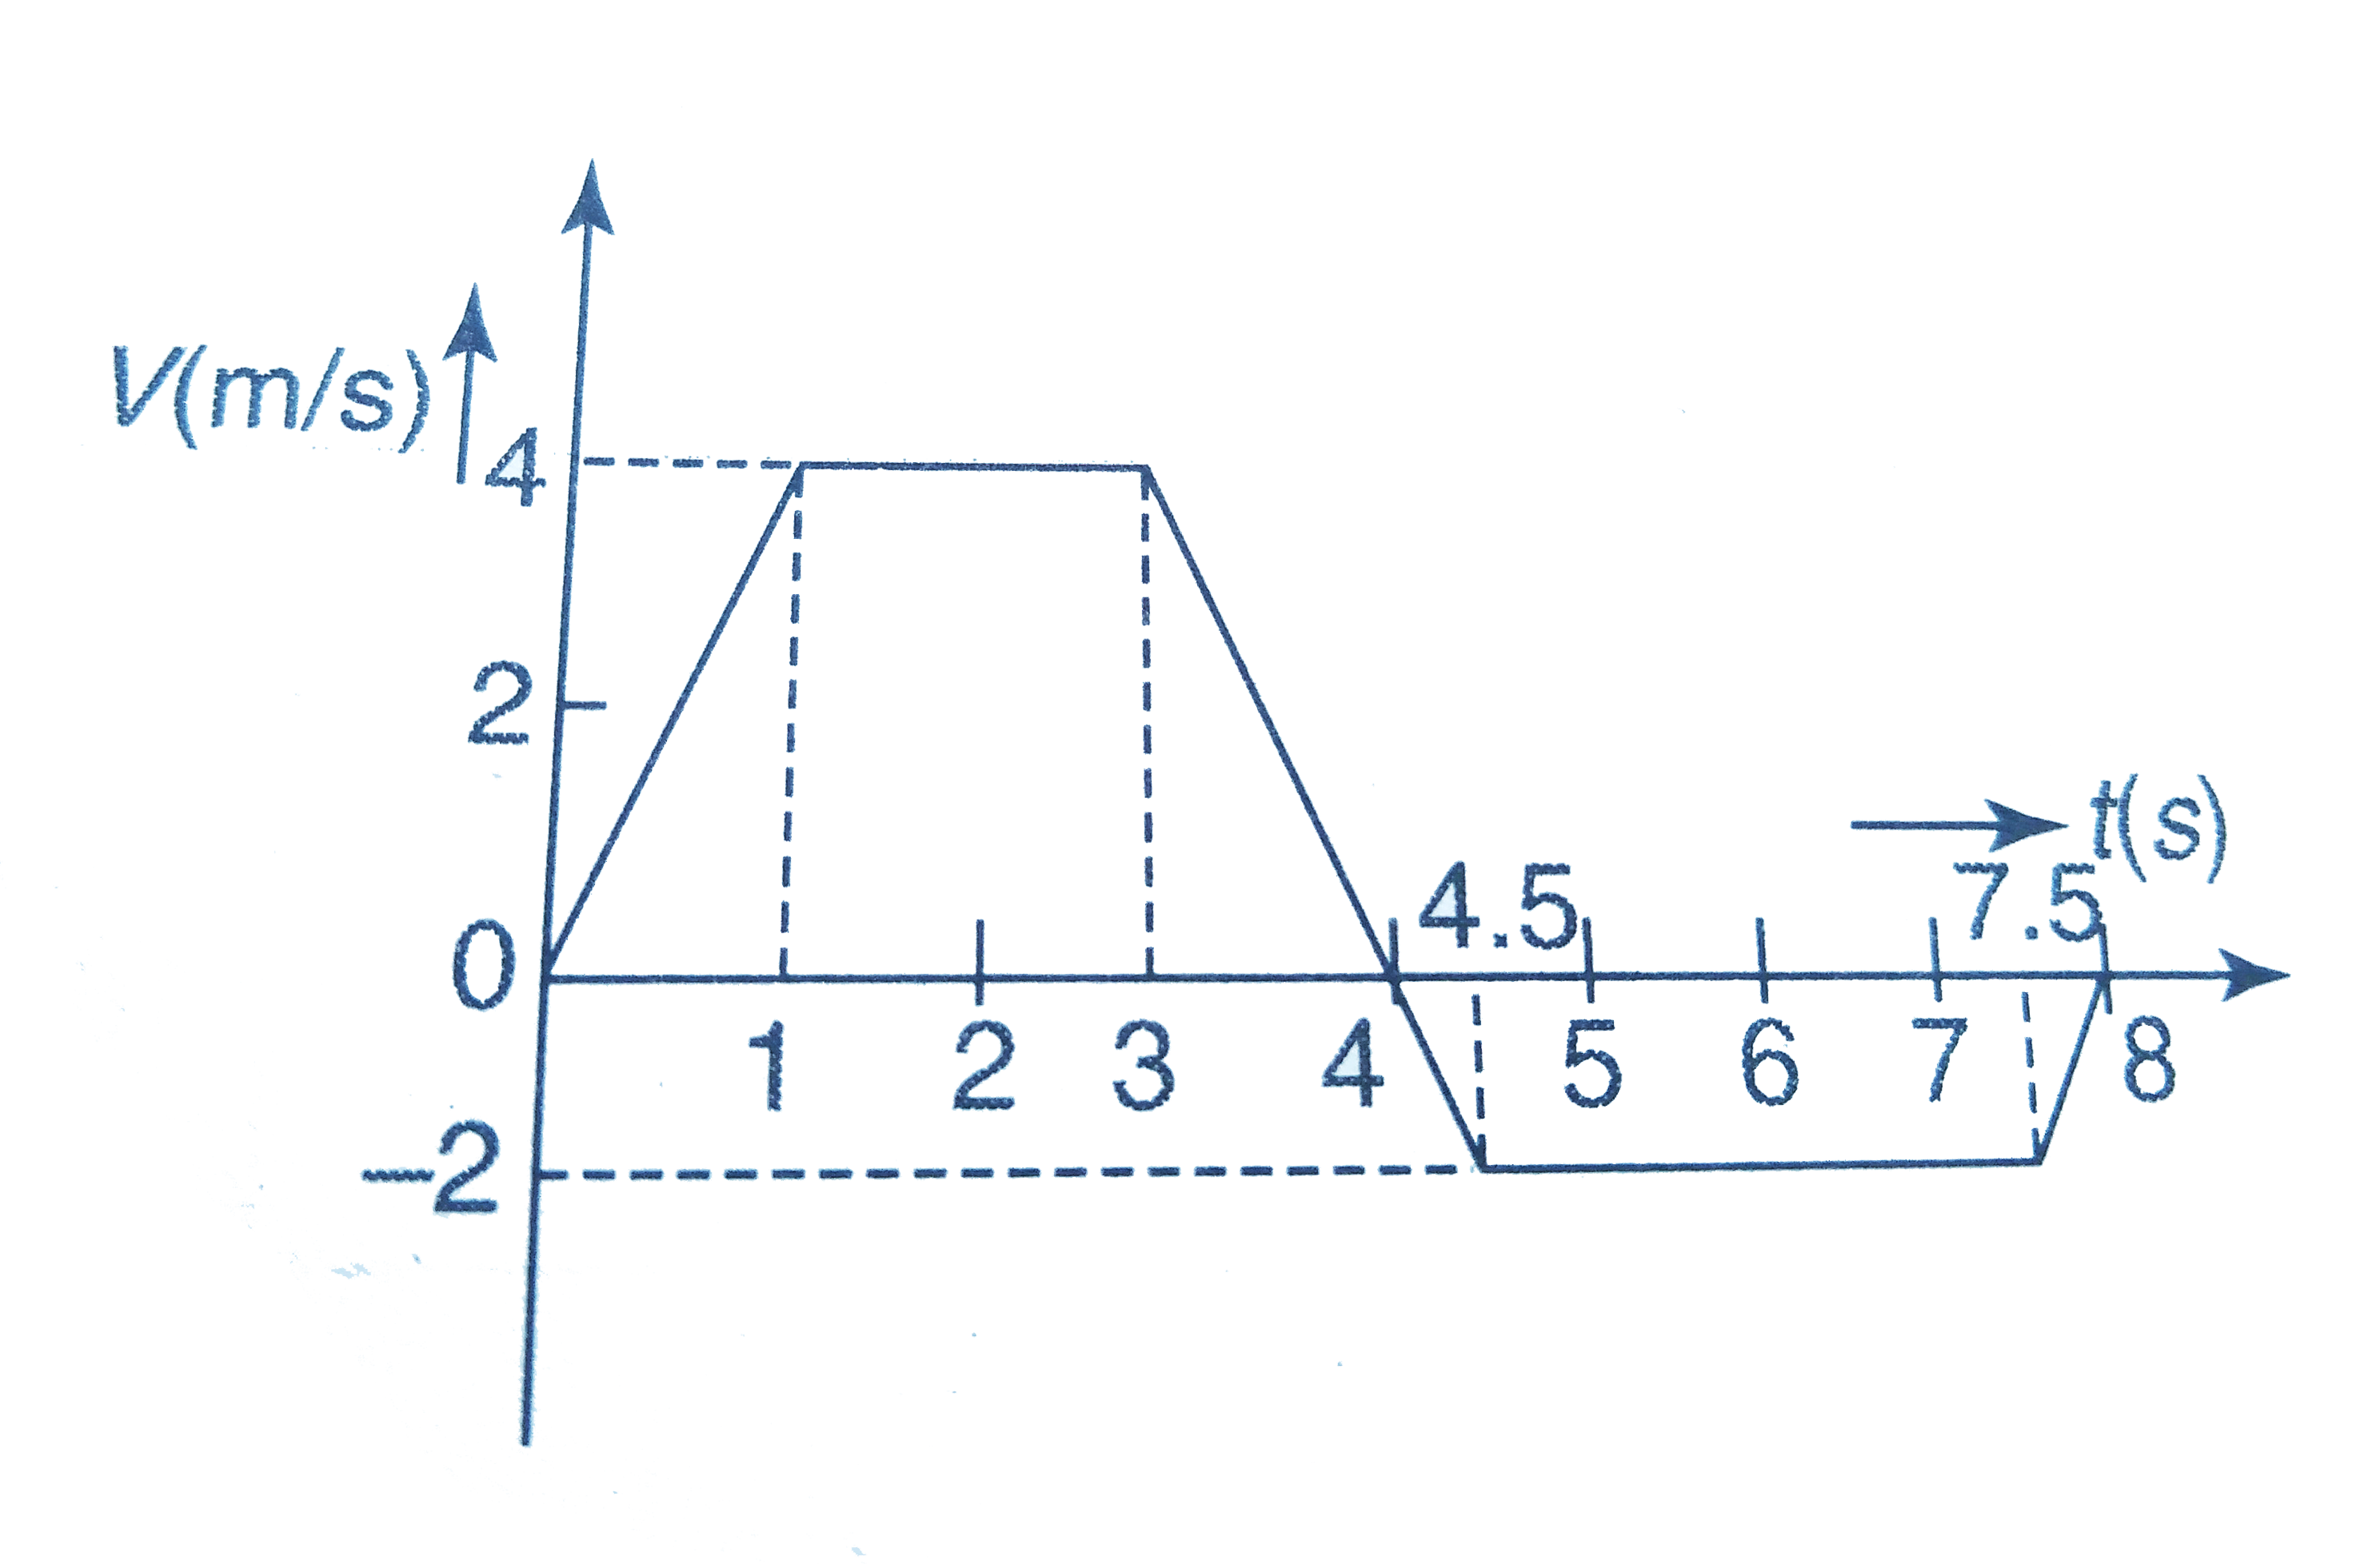 A5 mB16 mC8 mD19 m
Figure given shows the distance - time graph of the motion of a car. It follows from the graph that the car is
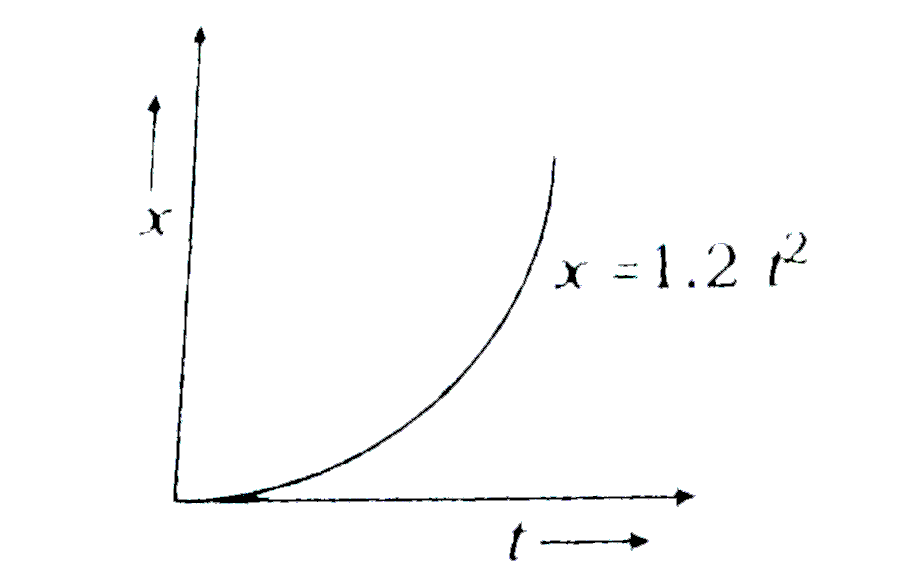
View SolutionThe distance-time graph of an object shown in figure 2.E2.
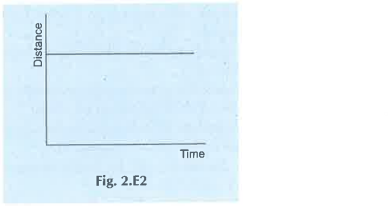
The object
View SolutionThe velocity-time graph of a linear motion is shown in figure. The displacement & distance from the origin after 8 sec is :-
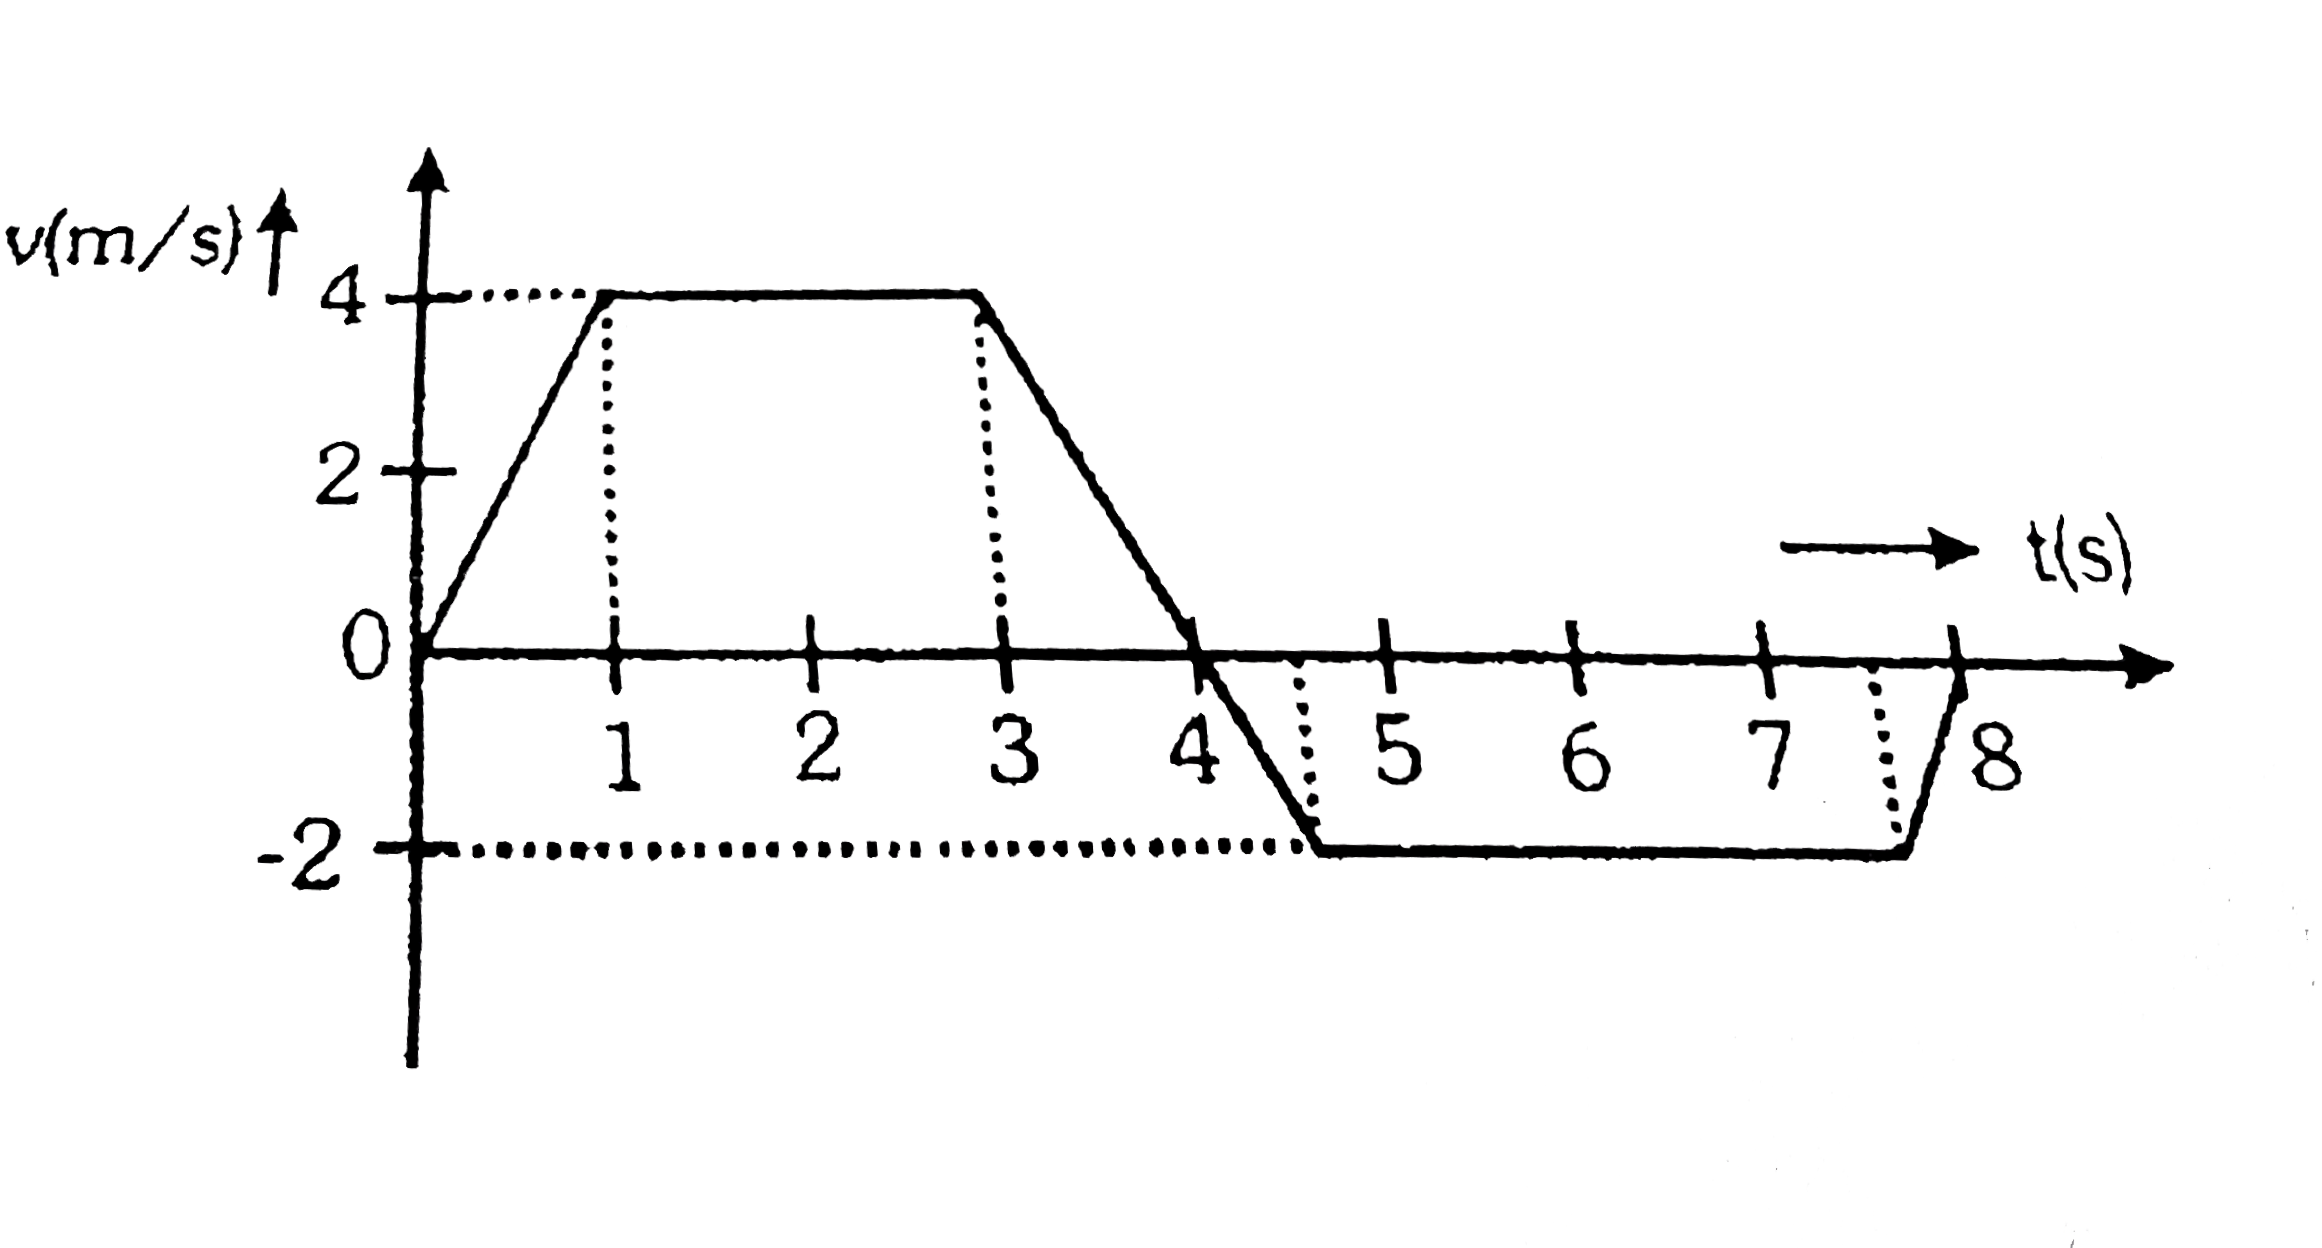
View SolutionThe velocity time graph of a linear motion is shown in the figure. The distance from the starting point after 8 seconds will be
 .
.
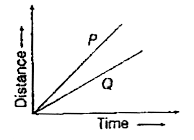
View SolutionFigure shows that distance-time graph for the motion of two vechicles P and Q. which one of them is moving faster ?
View Solution
