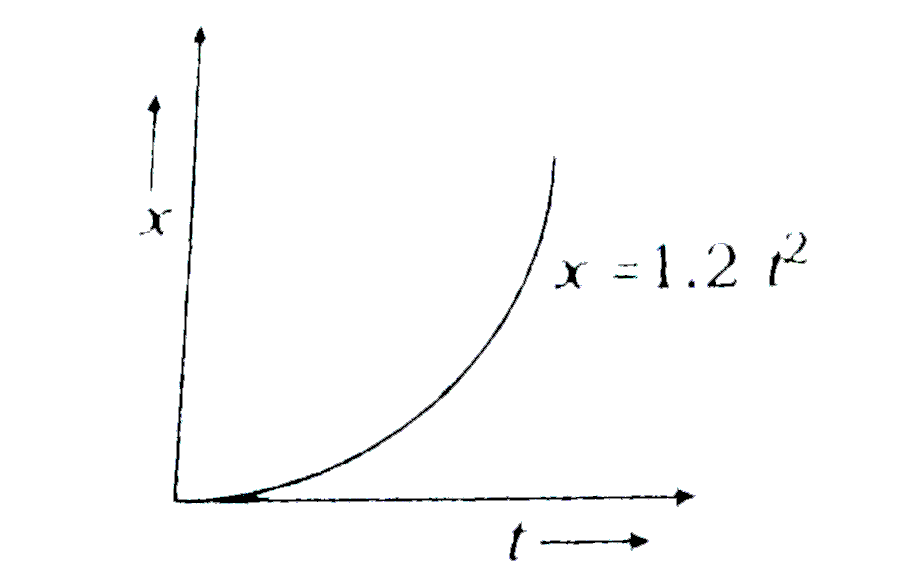
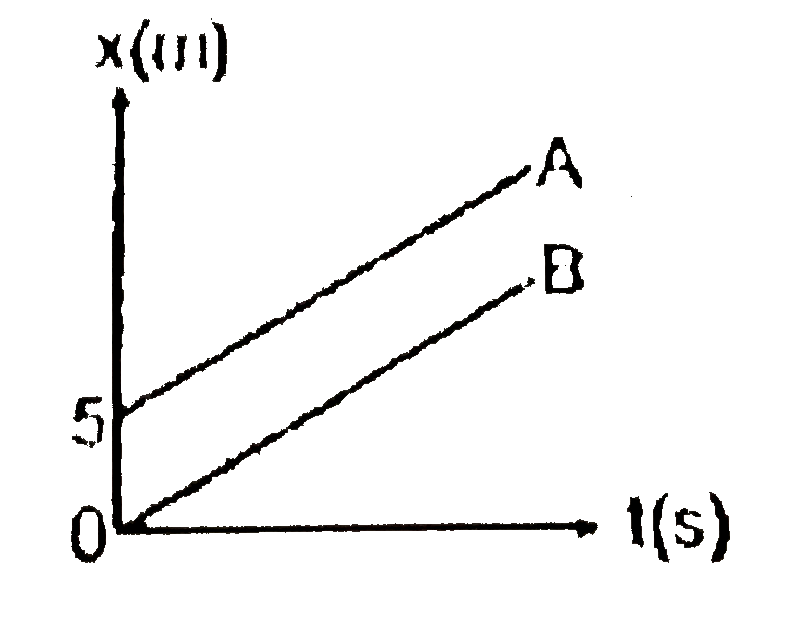
Figure given shows the distance - time graph of the motion of a car. It follows from the graph that the car is
at rest
in uniform motion
in non-uniform acceleration
uniformly accelerated
The correct Answer is:D
Since x=1.2t2, comparing if with equation of motion x=12at2.
Thus the motion is uniformly accelerated.
Topper's Solved these Questions
- MOTION IN A PLANEBOOK - DC PANDEYCHAPTER - MOTION IN A PLANEEXERCISE - (B) Meical entrance special format questions (Assertion and reason)
19 Videos
- MOTION IN A PLANEBOOK - DC PANDEYCHAPTER - MOTION IN A PLANEEXERCISE - (B) Meical entrance special format questions (Mathch the columns)
6 Videos
- MOTION IN A PLANEBOOK - DC PANDEYCHAPTER - MOTION IN A PLANEEXERCISE - Check point 3.7
15 Videos
- MOTIONBOOK - DC PANDEYCHAPTER - MOTIONEXERCISE - Medical entrances gallery
19 Videos
- PROJECTILE MOTIONBOOK - DC PANDEYCHAPTER - PROJECTILE MOTIONEXERCISE - Level - 2 Subjective
10 Videos
Similar Questions
Figure shows the distance-time graph for the motion of two vehicles A and B. Which one of them is moving faster?
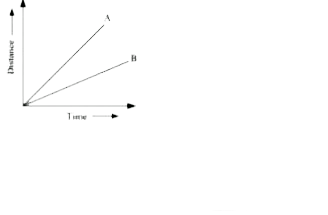
Distance-time graph for the motion of two cars
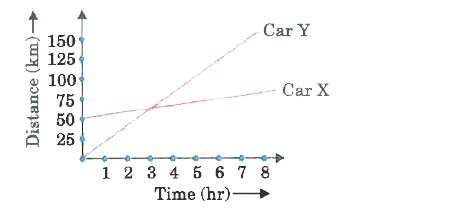
View SolutionThe figure given below shows the distance-time graph of the two cars, which began their journey together, in the same direction, from different points of start.
(i) find the speed of car X and Car Y.
(ii) When and where will car Y catch car X?
View Solution
Knowledge Check
Given figure shows the distance-time graph of the motion of a car. It follows from the,| graph that the car is
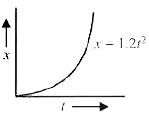 Aat restBin uniform motionCin non-uniform accclerationDunifommly accelerated.
The velocity time graph of the motion of a car is given here.
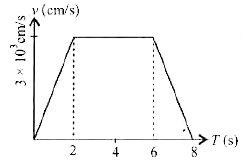 AThe distance travelled by the car in the first six seconds is 150 m.BThe deceleration of the car during the last two seconds are −15ms2.CThe distance travelled by the car in the first six second is 220 m.DThe deceleration of the car during the last two second is −20ms2
The graph of distance -time graph for uniform motion for an object is
Astraight lineBcurved lineCfirst straight line then curved lineDNone of these
Figure shows the displacement time graphs of two simple harmonic motions I and II. From the graph it follows that
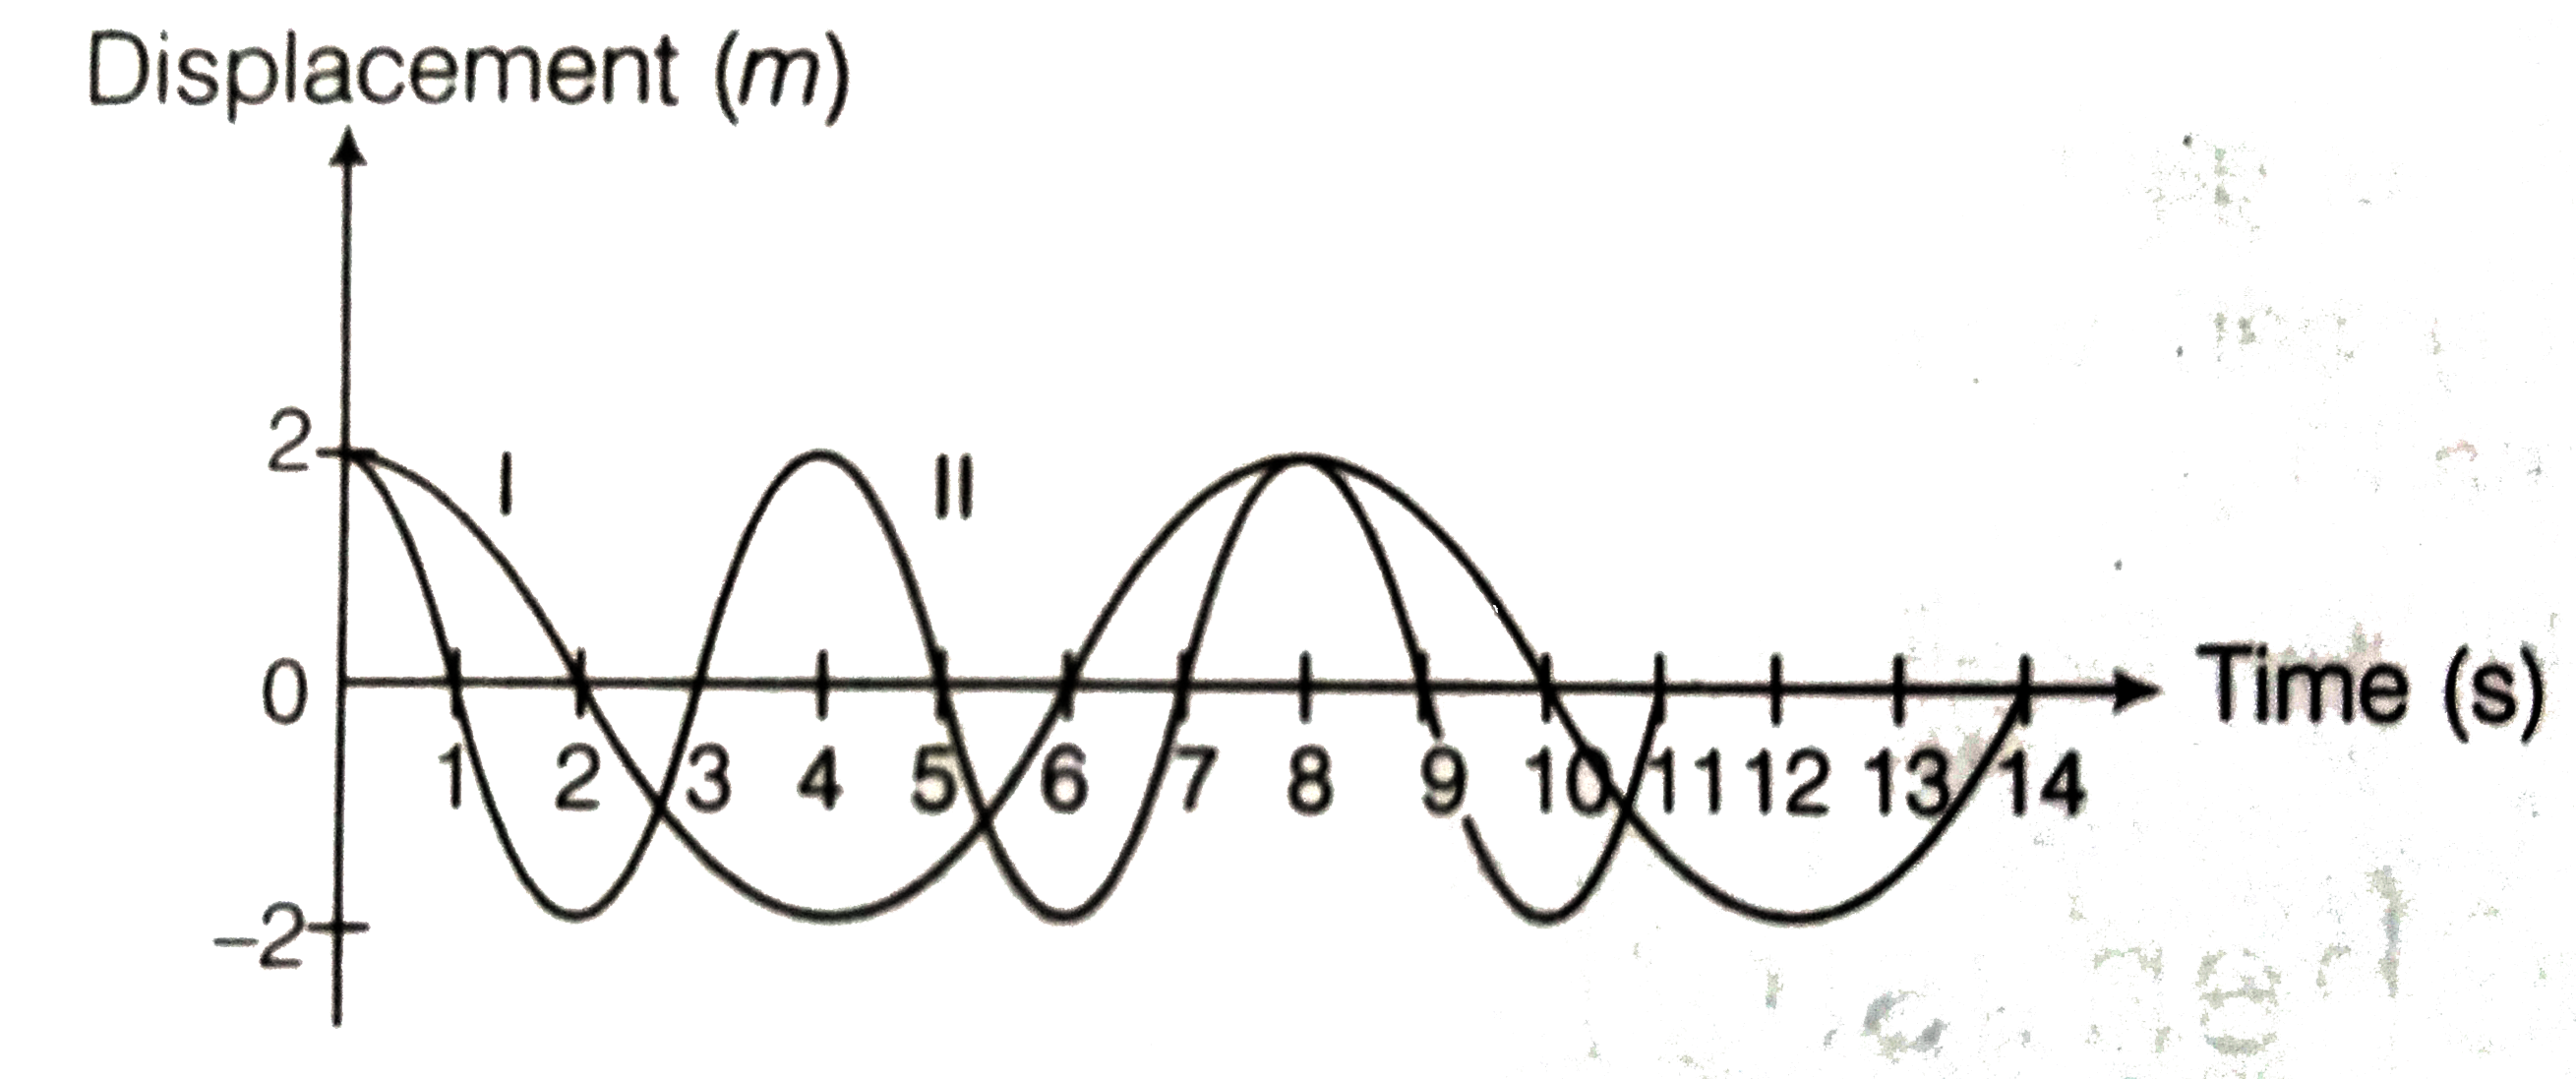
View SolutionThe shape of thedistance-time graph for the motion in the following case is,A car moving with a constantspeed is
View SolutionFigure shows the position-time graphs of three car A, B and C. On the basis of the graphs, answer the following questions : What is the relative velocity of car B with respect to car C ?
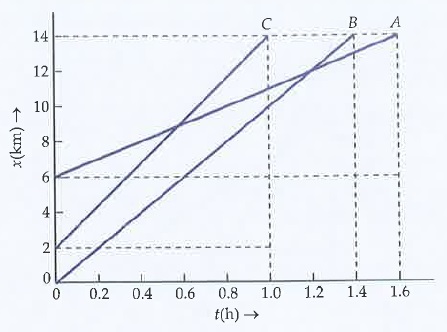
View SolutionFigure shows that distance-time graph for the motion of two vechicles P and Q. which one of them is moving faster ?
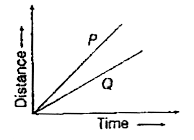
View SolutionFigure shows position-time graph of two cars A and B.
View Solution