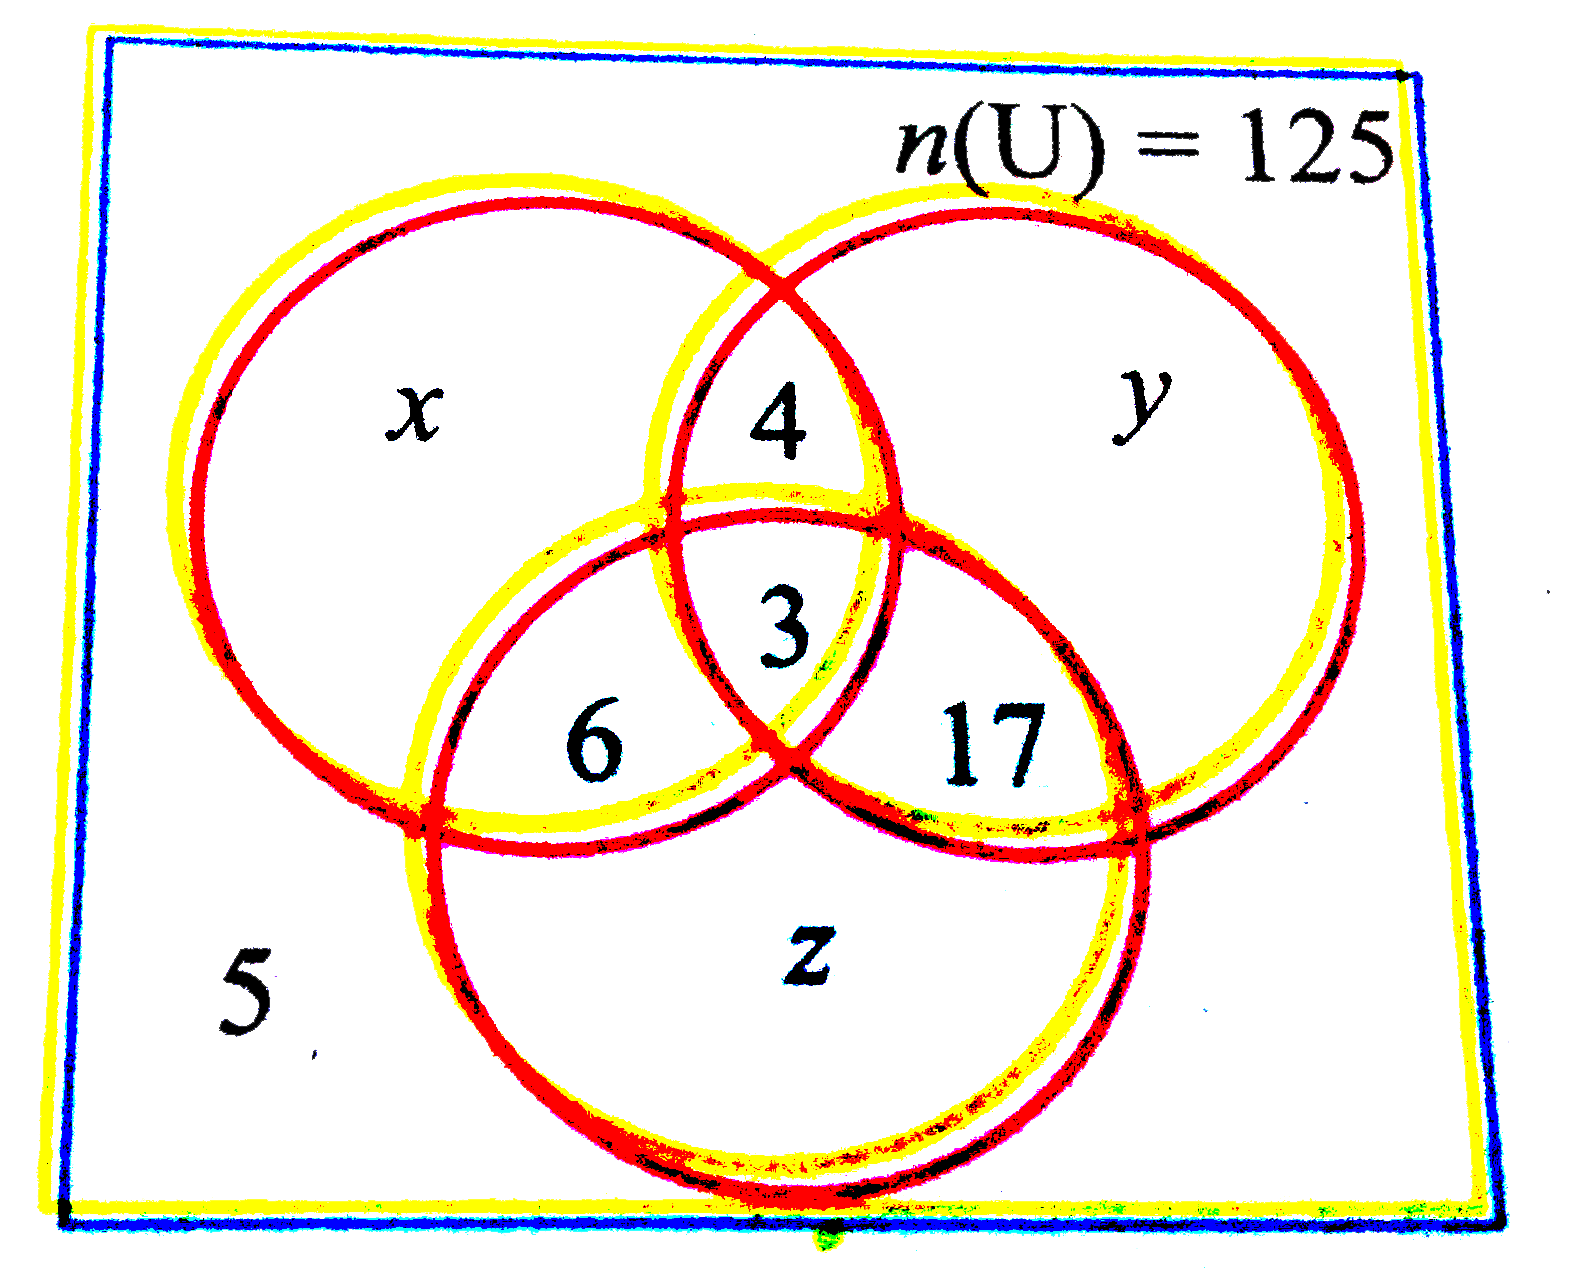
In the adjacent diagram, if n(U) = 125, y is two times of x and z is 10 more than x, then find the value of x, y and z.
 Solution in Tamil
Step by step video & image solution for In the adjacent diagram, if n(U) = 125, y is two times of x and z is 10 more than x, then find the value of x, y and z. by Maths experts to help you in doubts & scoring excellent marks in Class 9 exams.
Topper's Solved these Questions
- BOOK - SURA PUBLICATIONCHAPTER - SET LANGUAGEEXERCISE - EXERCISE 1.726videos
SET LANGUAGE
- BOOK - SURA PUBLICATIONCHAPTER - SET LANGUAGEEXERCISE - TEXT BOOK ACTIVITIES2videos
SET LANGUAGE
- BOOK - SURA PUBLICATIONCHAPTER - SET LANGUAGEEXERCISE - EXERCISE 1.519videos
SET LANGUAGE
- BOOK - SURA PUBLICATIONCHAPTER - REAL NUMBERS EXERCISE - UNIT TEST19videos
REAL NUMBERS
- BOOK - SURA PUBLICATIONCHAPTER - STATISTICSEXERCISE - Section -C2videos
STATISTICS
Similar Questions
Which of the following is correct?
02:11View SolutionDiscuss and give as many examples of collections from your daily life situations, which are sets and which are not sets.
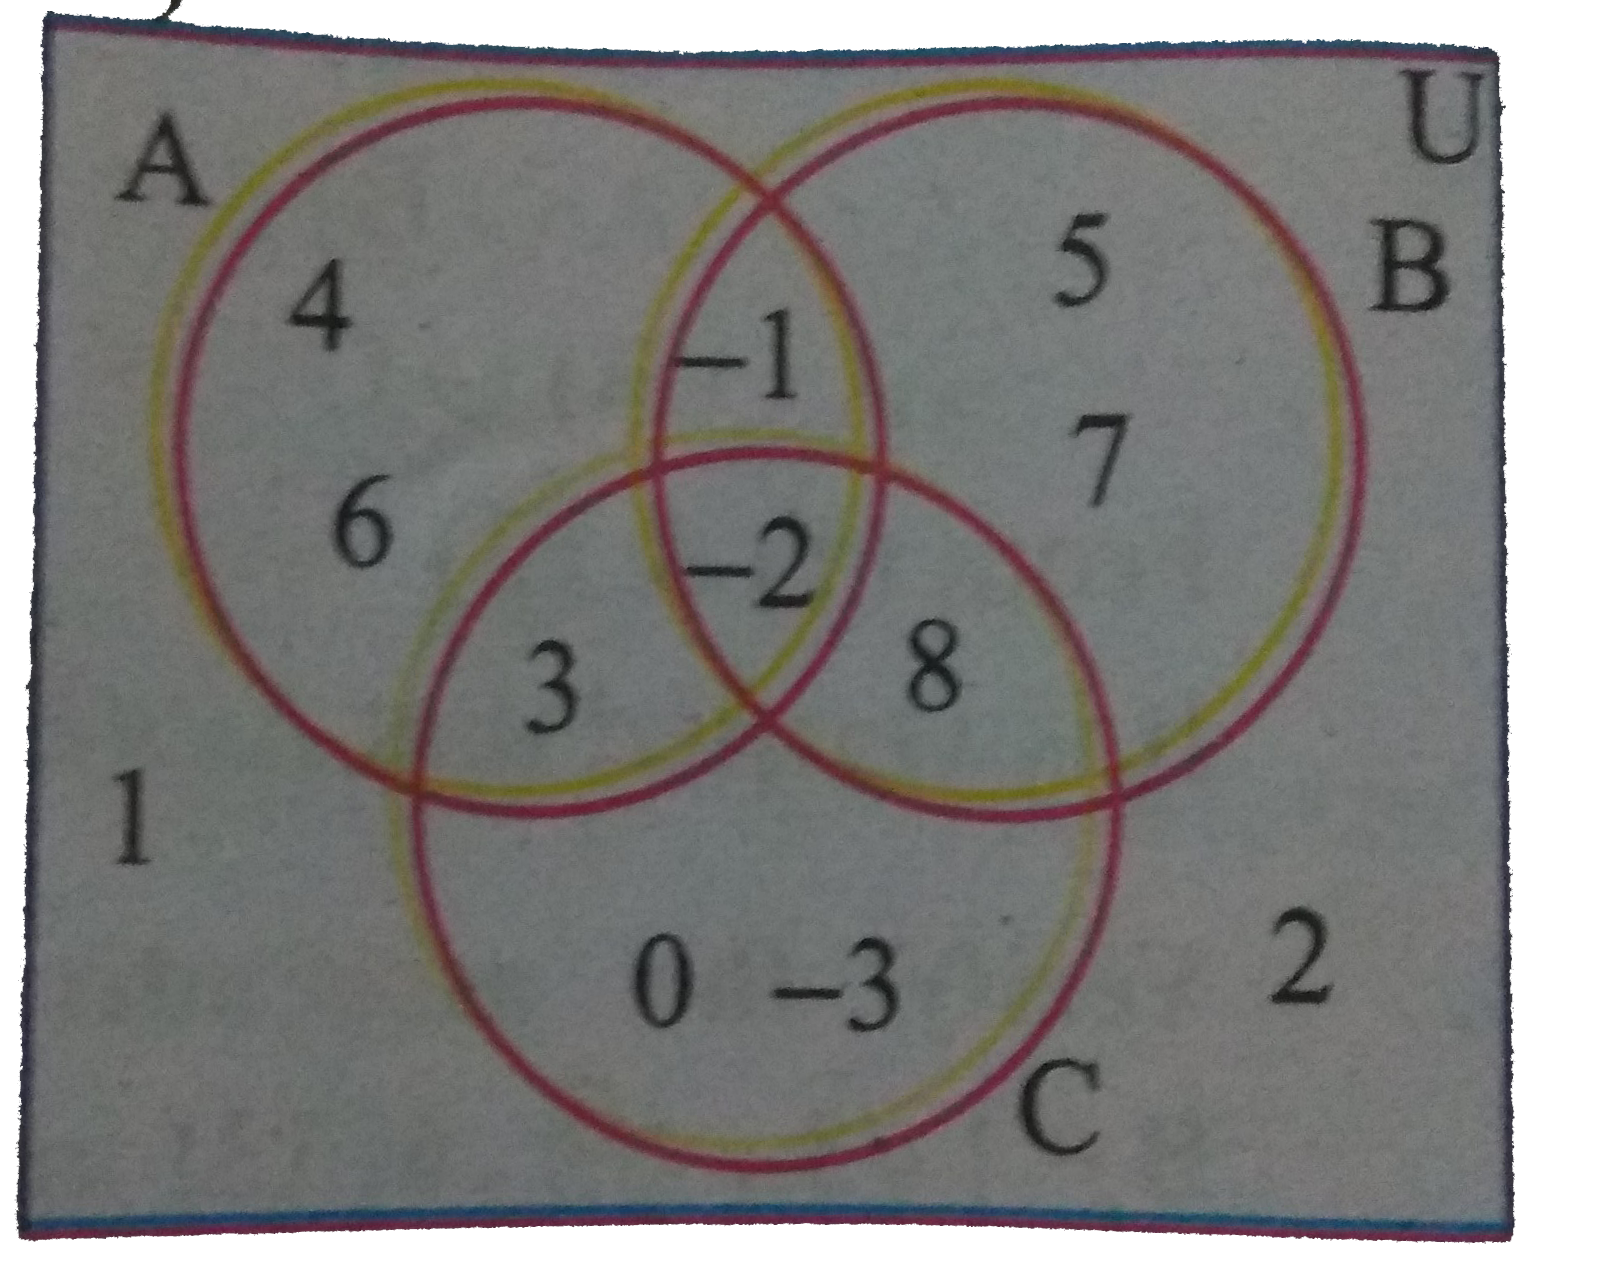
02:07View SolutionUsing the adjacent venn diagram, find the following sets :

(i) A - B
(ii) B - C
(iii) A'∪B'
(iv) A'∩B'
(v) (B∪C)'
(vi) A−(B∪C)
(vii) A−(B∩C)02:45View SolutionWhich one of the following , regarding sum of two irrational number , is true ?
02:17View SolutionCalculate the mean of the following distribution using Assumed Mean Method.
 05:41View Solution
Determine the point of symmetry of a regular hexagon.
02:21View SolutionComplete adjectant figure so that X-axis and Y-axis are the lines of symmetry of the completed figure.
02:10View SolutionMatch the following Column A to Column B
 02:17View Solution
Match the following Column A to Column B
 02:10View Solution
Match the following Column A to Column B
 02:50View Solution
Find the area of the figure given below.
 01:13View Solution
The inequation represented by the graph given below is :
01:50View SolutionThe inequation that best describes the graph given below is _________
01:10View SolutionThe inequation that best describes the following graph is _________
02:34View SolutionIn fig. O is the center of the circle. Find the value of x.
ltimg src="https://d10lpgp6xz60nq.cloudfront.net/physics_images/PS_MATH_IX_C12_S01_031_Q01.png" width="80%"gt01:54View Solution

