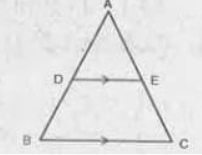
In the figure D,E are the midpoints of the sides AB and AC. IF DE=4cm, then BC=
 Solution in Telugu
4cm
6cm
8cm
12cm
The correct Answer is:C
Step by step video & image solution for In the figure D,E are the midpoints of the sides AB and AC. IF DE=4cm, then BC= by Maths experts to help you in doubts & scoring excellent marks in Class 10 exams.
Topper's Solved these Questions
- BOOK - VGS PUBLICATION-BRILLIANTCHAPTER - SIMILAR TRIANGLES EXERCISE - OBSERVATION BITS TO SOLVE VARIOUS BITS IN THE GIVEN IN THE PUBLIC EXAMINATION29videos
SIMILAR TRIANGLES
- BOOK - VGS PUBLICATION-BRILLIANTCHAPTER - SETS EXERCISE - CREATIVE BITS OF CCE MODEL EXAMINATION116videos
SETS
- BOOK - VGS PUBLICATION-BRILLIANTCHAPTER - STATISTICSEXERCISE - EXERCISE146videos
STATISTICS
Similar Questions
The maximum nuber of possible tangents that can be draw to a circle is ……..
01:37View SolutionLet A={1,2,{1},{1,2},3,4}, then which of the following is true?
02:11View SolutionThe mean value can be calculated from both ungrouped and grouped date . Which one you think is more accurate ? Why ?
01:31View SolutionHow many lines of symmetry does the above figure have ?
02:46View SolutionDetermine the point of symmetry of a regular hexagon.
02:45View SolutionDtermine the images of the following figure about the given line :
02:17View SolutionIn the figure above (not to scale), ¯¯¯¯¯¯AB⊥¯¯¯¯¯¯CDandAD is the bisector of ∠BAE.AB=3cm and AC=5cm. Find CD.
05:41View SolutionMatch the following Column A to Column B
 02:21View Solution
Match the following Column A to Column B
 02:03View Solution
Match the following Column A to Column B
 02:10View Solution
Find the area of the figure given below.
 02:17View Solution
The area of the shaded part in the figure given below is ______.
 02:10View Solution
The inequation represented by the graph given below is :
04:23View SolutionThe inequation that best describes the graph given below is _________
01:13View SolutionThe inequation that best describes the following graph is _________
01:59View SolutionWhich inequations represent the shaded region in the given figure
01:19View Solution

