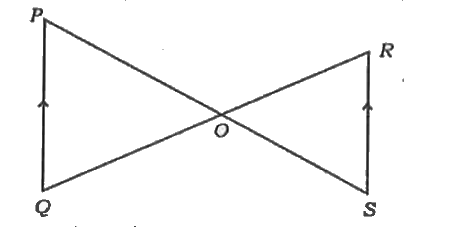
In the given figure PQ ∣∣ RS , prove that ΔPOQ~ΔSOR.
 Solution in Kannada
Step by step video & image solution for In the given figure PQ || RS , prove that Delta POQ~Delta SOR. by Maths experts to help you in doubts & scoring excellent marks in Class 10 exams.
Updated on:21/07/2023Topper's Solved these Questions
- PRACTICE QUESTION PAPER 13BOOK - CPC CAMBRIDGE PUBLICATIONCHAPTER - PRACTICE QUESTION PAPER 13EXERCISE - ANSWER THE FOLLOWING QUESTIONS
34 Videos
- PRACTICE QUESTION PAPER 12BOOK - CPC CAMBRIDGE PUBLICATIONCHAPTER - PRACTICE QUESTION PAPER 12EXERCISE - ANSWER THE FOLLOWING QUESTION
32 Videos
- PROBABILITYBOOK - CPC CAMBRIDGE PUBLICATIONCHAPTER - PROBABILITYEXERCISE - EXERCISE 14. 2 (OPTIONAL)
5 Videos
Similar Questions
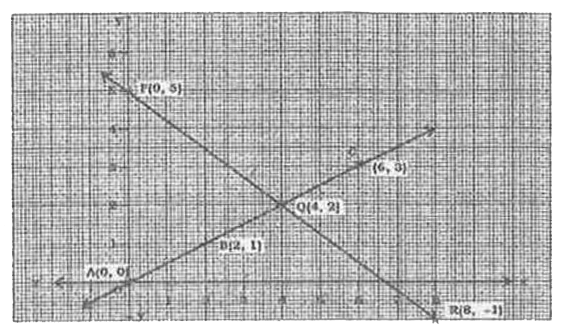
The given graph represents a pair of linear equations in two variables : write how many solutions these pair of equations have

View SolutionIf the product of zeroes of polynomial f(y) =ay3−6y2+11y−6 is 4 then find the value of 'a'.
View SolutionTwo customers shyam and Ekta are visiting a particular shop in the same week (Tuesday to Saturday) . Each is equally likely to visit the shop on any day as on another day. What is the probability that both will visit the shop on (i) the same day ? (ii) consecutive day ? (iii) different days ?
View SolutionHow many lines of symmetry does the above figure have ?
View SolutionDetermine the point of symmetry of a regular hexagon.
View SolutionDtermine the images of the following figure about the given line :
View SolutionMatch the following Column A to Column B

View SolutionMatch the following Column A to Column B

View SolutionMatch the following Column A to Column B

View SolutionFind the area of figure given below.

View SolutionFind the perimeter of the figure given below.

View SolutionFind the area of the figure given below.

View SolutionThe area of the shaded part in the figure given below is ______.

View SolutionThe inequation represented by the graph given below is :
View SolutionThe inequation that best describes the graph given below is _________
View SolutionThe inequation that best describes the following graph is _________
View Solution
