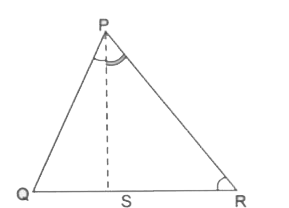
In the given figure, PR>PQ and PS bisect ∠QPR. Prove that:
∠PSR>∠PSQ
 Solution in Kannada
Step by step video & image solution for In the given figure, PR gt PQ and PS bisect angleQPR. Prove that: anglePSR gt anglePSQ by Maths experts to help you in doubts & scoring excellent marks in Class 9 exams.
Topper's Solved these Questions
- BOOK - CPC CAMBRIDGE PUBLICATIONCHAPTER - TRIANGLES EXERCISE - EXERCISE 5.5 (Optional)4videos
TRIANGLES
- BOOK - CPC CAMBRIDGE PUBLICATIONCHAPTER - TRIANGLES EXERCISE - EXERCISE 5.35videos
TRIANGLES
- BOOK - CPC CAMBRIDGE PUBLICATIONCHAPTER - SURFACE AREAS AND VOLUMES EXERCISE - EXERSICE 13.810videos
SURFACE AREAS AND VOLUMES
Similar Questions
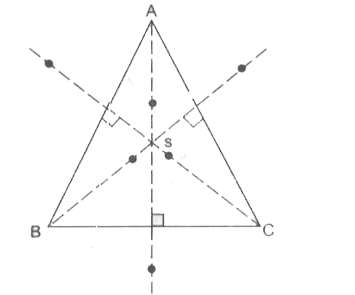
ABC is a triangle . Locate a point in the interior of △ABC which is equidistant from all the vertices of △ABC.
 01:37View Solution
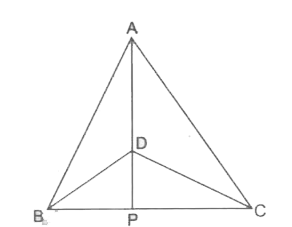
△ABC and △DBC are two isosceles triangles on the same base BC and vertices A and D are on the same side of BC. If AD is extended to intersect BC at P, show that:
(i) △ABD≅△ACD
(ii) △ABP≅△ACP
(iii) AP bisects ∠A as well as ∠D
(iv) AP is the perpendicular bisector of BC.
 02:11View Solution
Find the volume of a sphere whose radius is
(i) 7 cm,
(ii) 0.63m01:31View SolutionHow many lines of symmetry does the above figure have ?
02:45View SolutionDetermine the point of symmetry of a regular hexagon.
02:17View SolutionDtermine the images of the following figure about the given line :
05:41View SolutionMatch the following Column A to Column B
 03:28View Solution
Match the following Column A to Column B
 02:31View Solution
Match the following Column A to Column B
 02:21View Solution
Find the area of figure given below.
 02:03View Solution
Find the perimeter of the figure given below.
 02:10View Solution
Find the area of the figure given below.
 02:17View Solution
The area of the shaded part in the figure given below is ______.
 02:10View Solution
The inequation represented by the graph given below is :
04:23View SolutionThe inequation that best describes the graph given below is _________
03:02View SolutionThe inequation that best describes the following graph is _________
01:59View Solution

