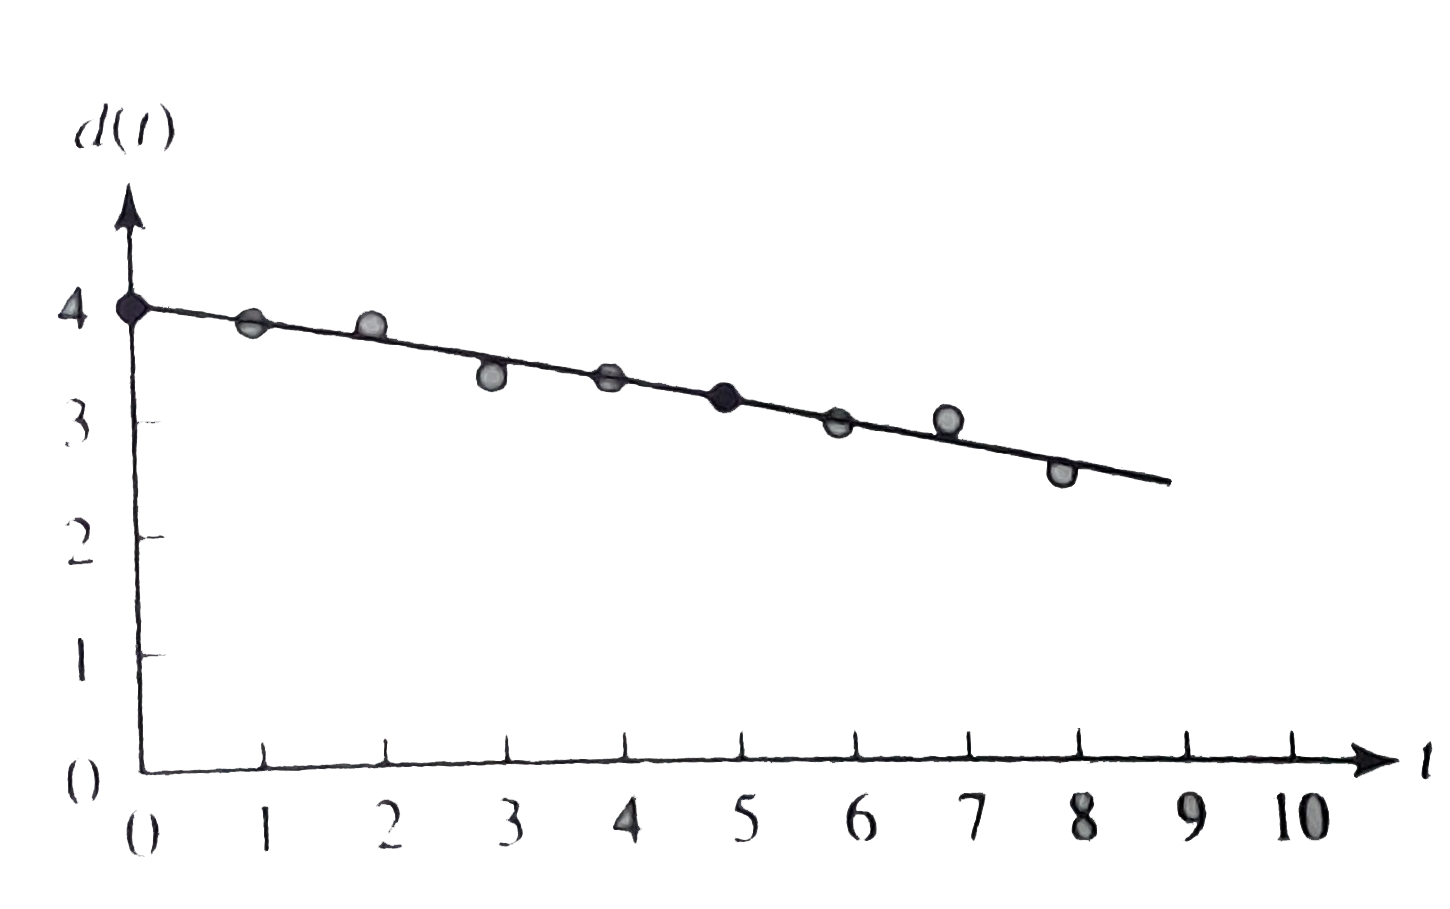
Joe bikes 4 kilometers to school . Because of the traffic and road conditions along the way , his speed varies. The dots on the graph above show his distance from the school at various times , starting at home at t=0 (black dot). After 5 minutes Joe is 3.2 kilometers from the school (second black dot). The data show that his speed is almost constant , and his distance from the school can be approximated by a straight line . The graph of the function that models Joe's distance from school as a function of time , in minutes , is shown as a solid line. Which of the following equations best represents this function ?
d(t)=-0.5 t+4
d(t)=-0.16 t +4
d(t)=-6.25 t+4
d(t)=0.16 t +4
The correct Answer is:B
Step by step video, text & image solution for Joe bikes 4 kilometers to school . Because of the traffic and road conditions along the way , his speed varies. The dots on the graph above show his distance from the school at various times , starting at home at t=0 (black dot). After 5 minutes Joe is 3.2 kilometers from the school (second black dot). The data show that his speed is almost constant , and his distance from the school can be approximated by a straight line . The graph of the function that models Joe's distance from school as a function of time , in minutes , is shown as a solid line. Which of the following equations best represents this function ? by Maths experts to help you in doubts & scoring excellent marks in Class 12 exams.
Updated on:21/07/2023Topper's Solved these Questions
Similar Questions
Ratio of distance of the school from Mary’s home to the distanceof the school from John’s home is 2 : 1.(a) Who lives nearer to the school?(b) Complete the following table which shows some possible distances that Mary and John could live from the schoolIf the ratio of distance of Mary’s home to the distance of Kalam’s home from school is 1 : 2, then who lives nearer to the school?
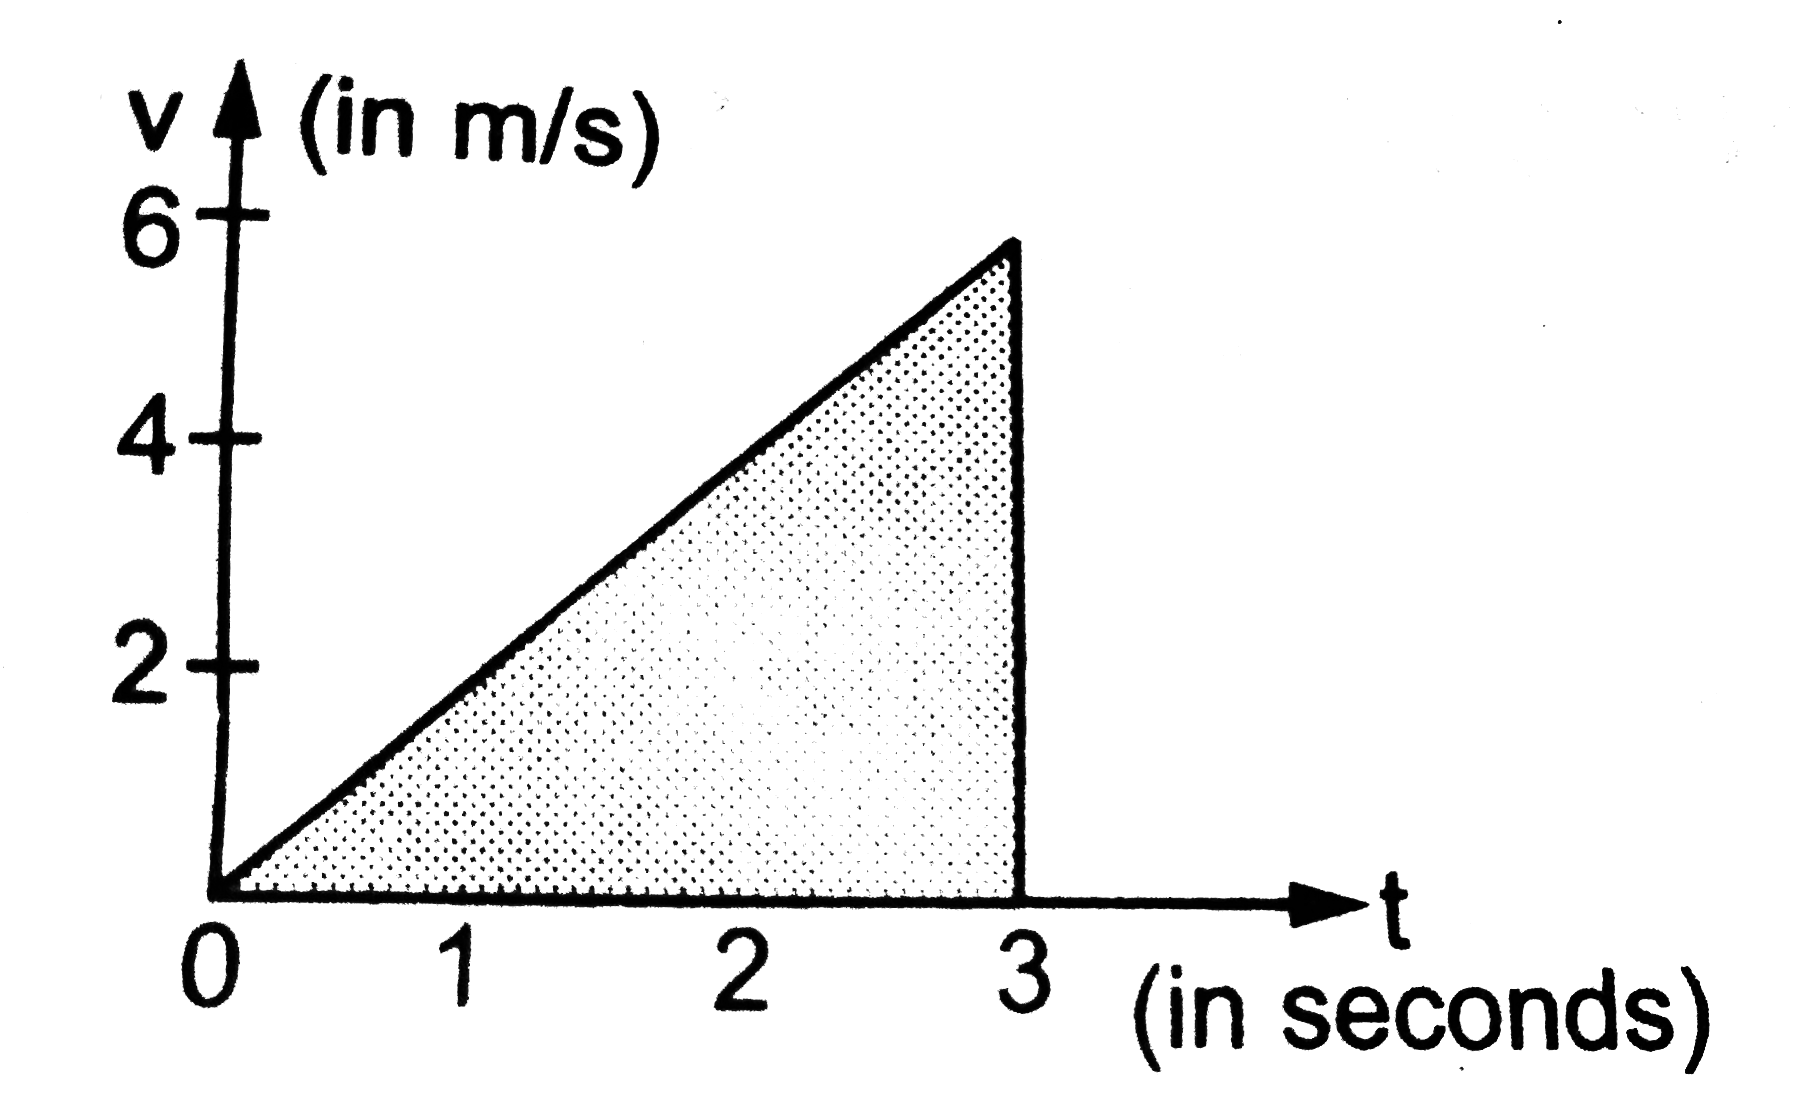
View SolutionFigure shows the speed versus time graph for a particle. Find the distance travelled by the particle during the time t=0 to t=3s.
View Solution
Knowledge Check
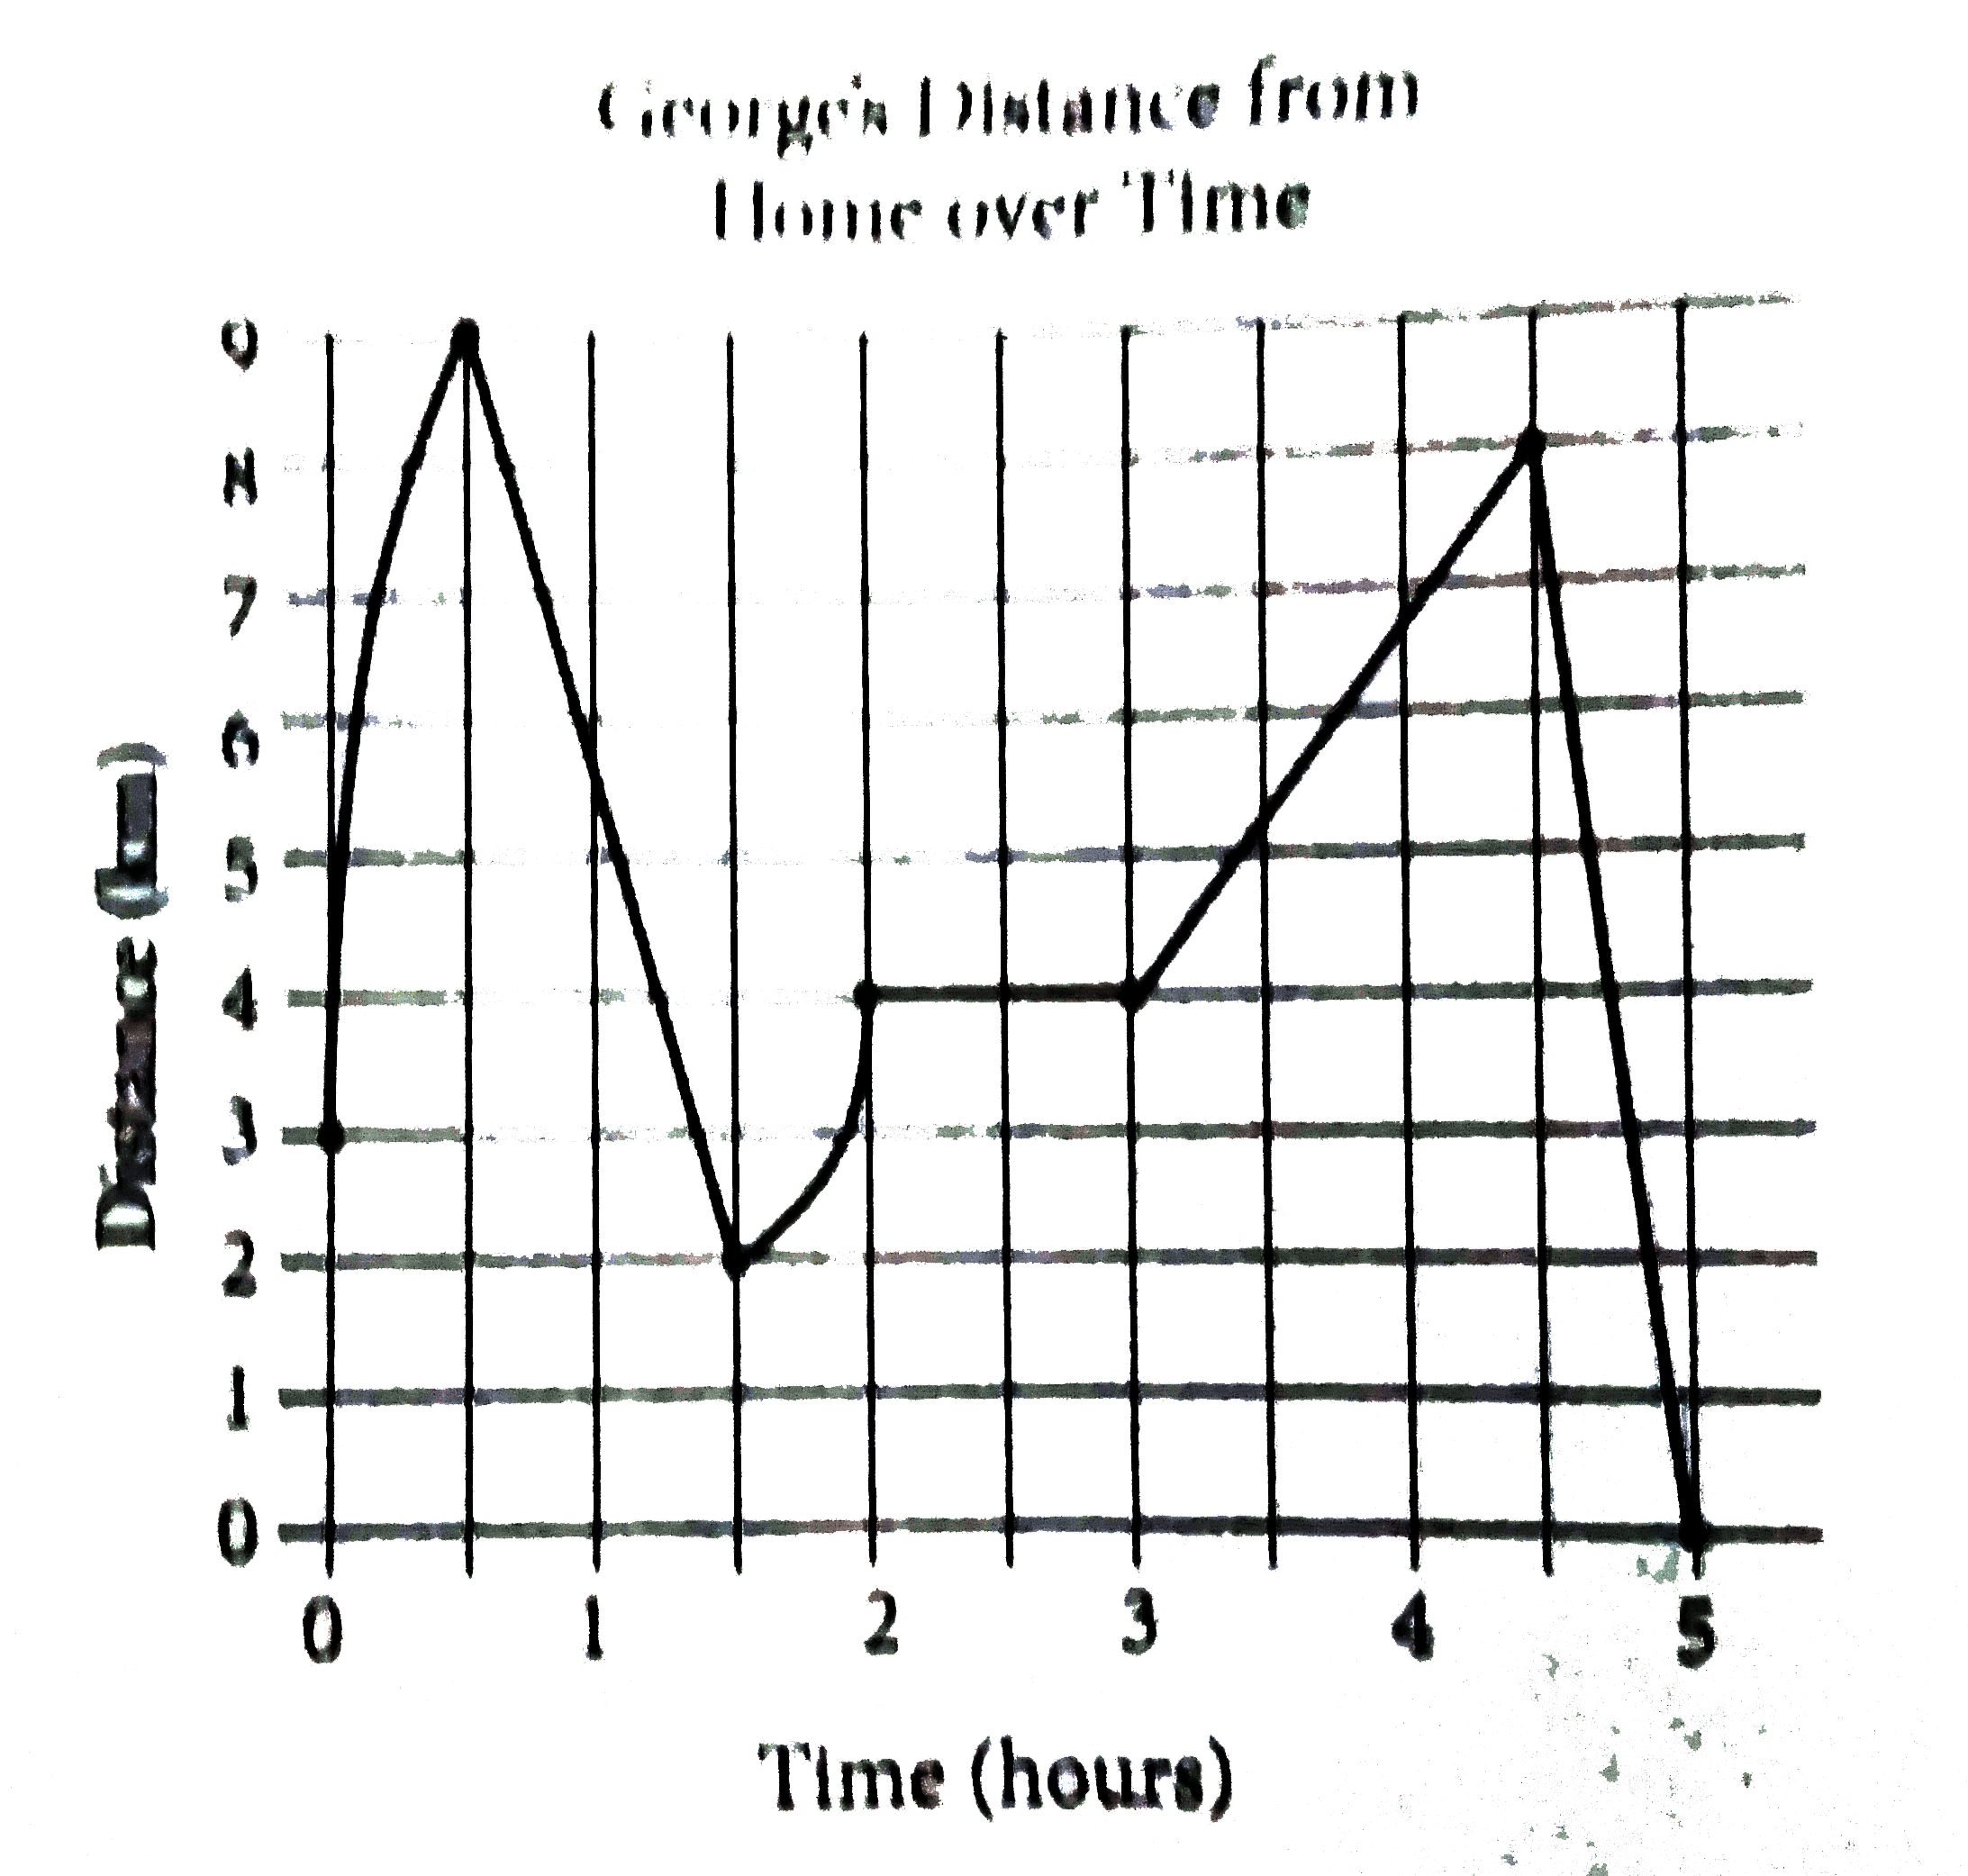
George recorded his distance from home over a five-hour period, his distance and time are shown in the graph above. According to the graph , which of the following is NOT true about the five-hour period?AGeorge's distance from home increased at a constant rate during the first hour of the five-hour period.BGeorge's distance from home reached its maximum during the first hour.CGeorge remained a constant distance from his home for one hour.DGeorge was moving further from his home for a longer period of time than he was moving closer to his home.If the person shows the production of interferons in his body, chances are that he is suffering from
AAnthraxBMalariaCMeaslesDTetanus
One day a boy walked from his house to his school at the speed of 4 km/hr and he reached ten minutes late to the school. Next day, he ran at the speed of 8 km/hr and was 5 minutes early to the school. Find the distance between his house and school.
View SolutionYou fall off your bike on the way home from school.
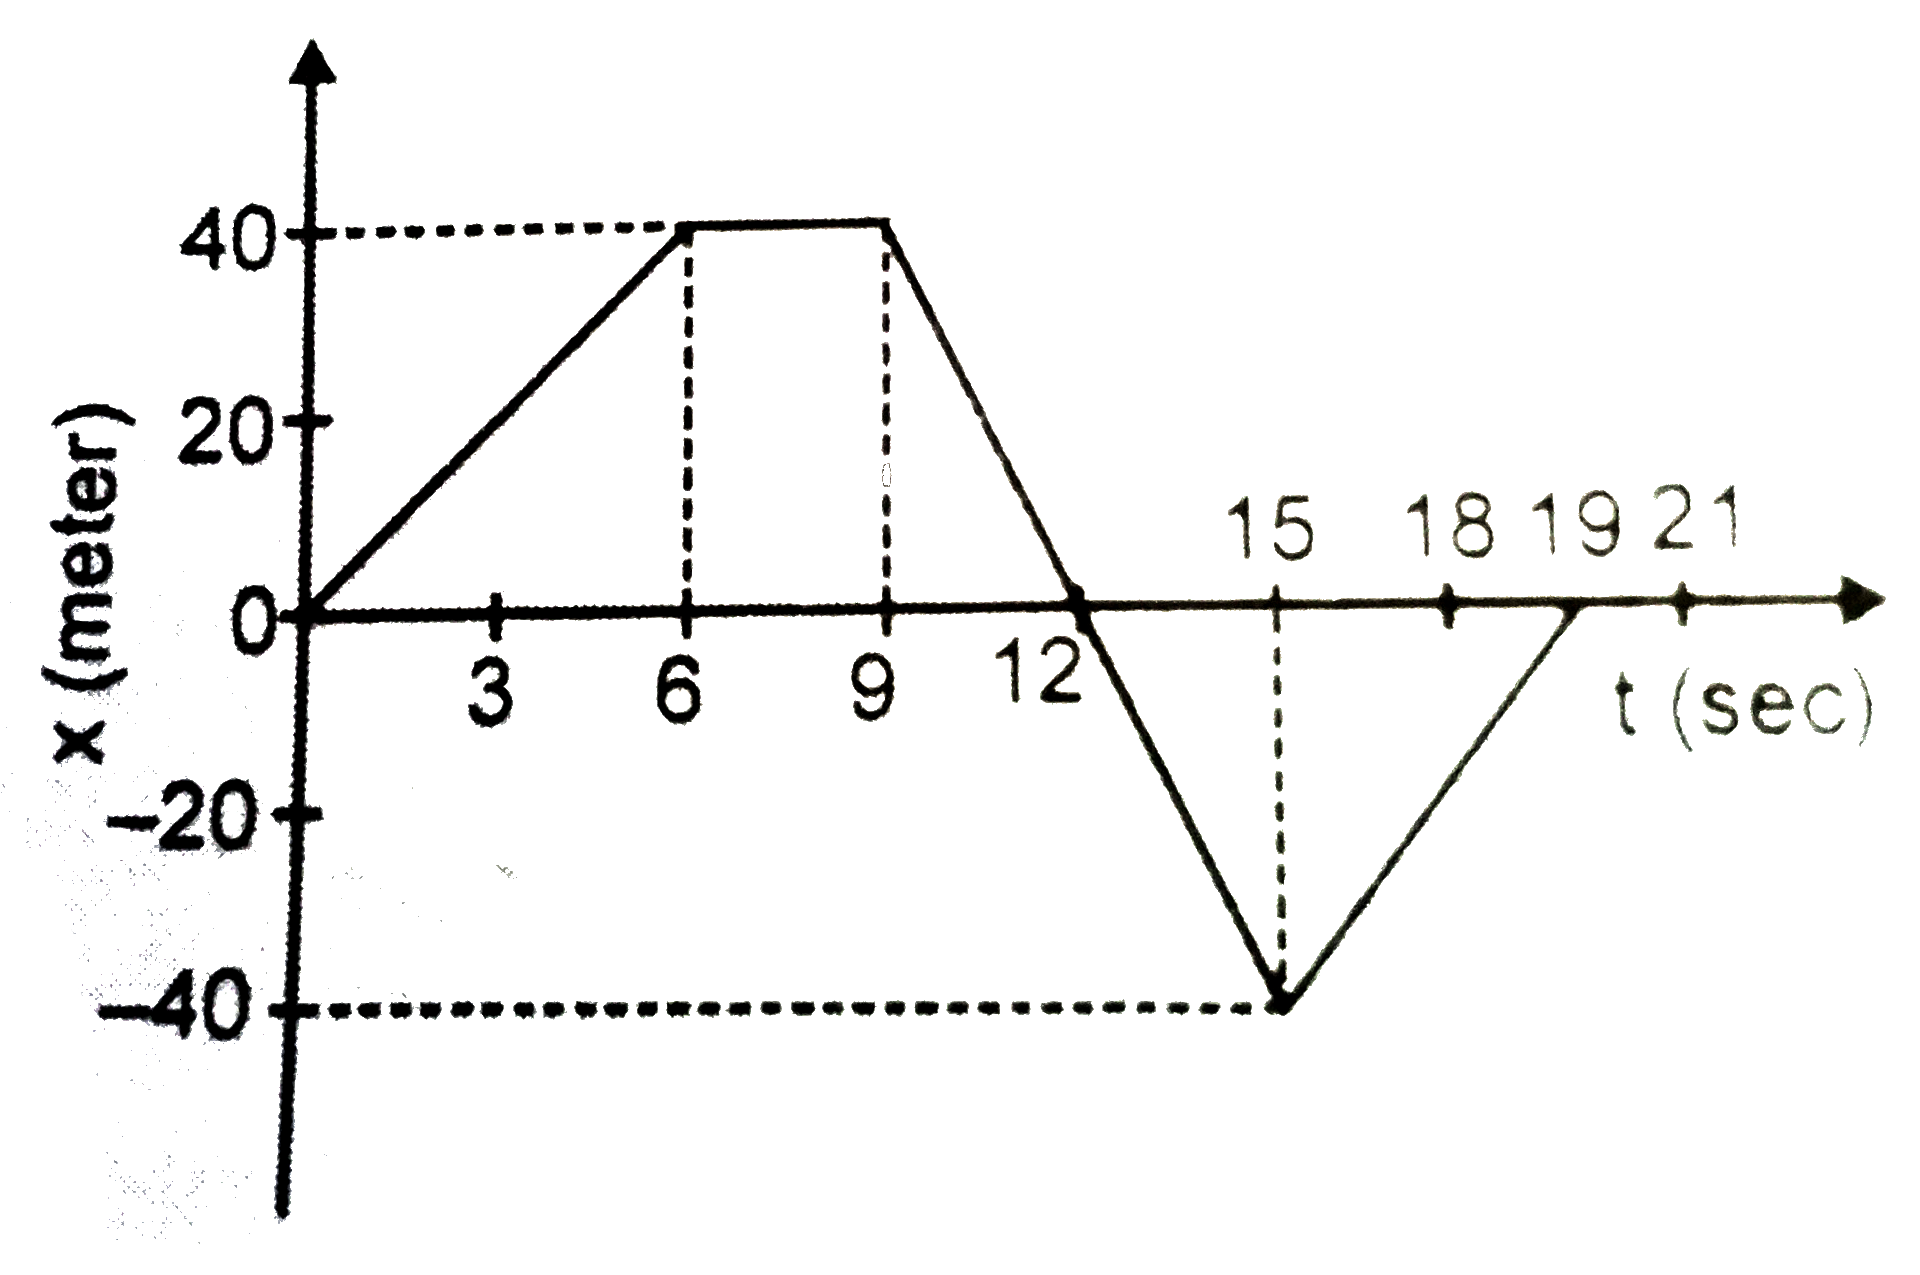
View SolutionA person walks along an east-west street and a graph of his displacement from home is shown in figure. His average velocity for the whole time interval is:-
View SolutionJohn walks to a library which is x km away from his home. On his way back home, he stops at a shop that is 14 of the distance he had walked earlier. Find the distance of the shop from John's home.
View SolutionIf the person shows the production of interferons in his body, changes are that he is suffering from
View SolutionIf a man has a velocity varying with time given as v=3t3,v is in m/s and t in sec then :
Find out his acceleration after 4 seconds :
View Solution
