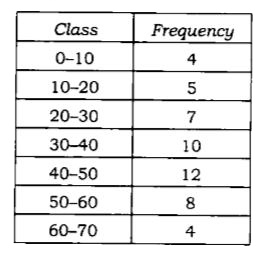
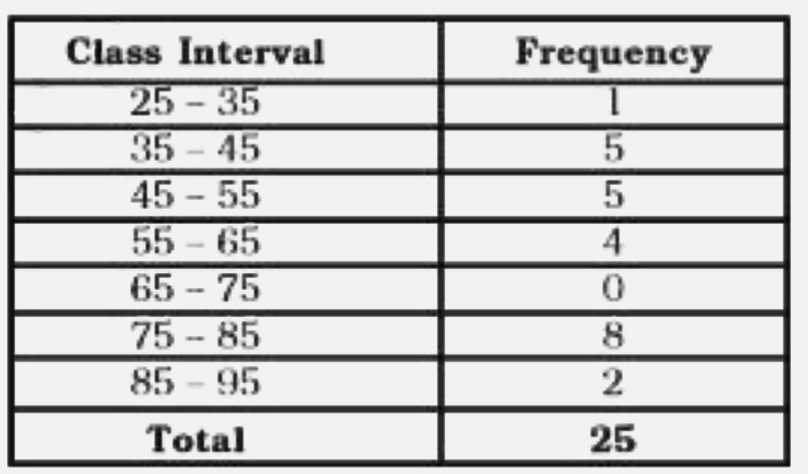
Look at the frequency distribution table given below

The median of the above distribution is
56.5
57.5
58.5
59
We have

Here N=50⇒=25 , which lies in class interval 55-65
Median =l+⎧⎪
⎪⎨⎪
⎪⎩h×(N2−cf)f⎫⎪
⎪⎬⎪
⎪⎭=55+(65−55)20×(25−20)=57.5
Topper's Solved these Questions
- MEAN,MEDAN,MODE OF GROUPED,DATA CUMULATIVE FREQUENCY GRAPH AND OGIVE Book:RS AGGARWALChapter:MEAN,MEDAN,MODE OF GROUPED,DATA CUMULATIVE FREQUENCY GRAPH AND OGIVE Exercise:Test Yourself
Explore 18 Videos
- MEAN,MEDAN,MODE OF GROUPED,DATA CUMULATIVE FREQUENCY GRAPH AND OGIVE Book:RS AGGARWALChapter:MEAN,MEDAN,MODE OF GROUPED,DATA CUMULATIVE FREQUENCY GRAPH AND OGIVE Exercise:Multiple Choice Questions (Mcq)
Explore 23 Videos
- LINEAR EQUATIONS IN TWO VARIABLES Book:RS AGGARWALChapter:LINEAR EQUATIONS IN TWO VARIABLES Exercise:QUESTION
Explore 2 Videos
- PERIMETER AND AREA OF PLANE FIGURES Book:RS AGGARWALChapter:PERIMETER AND AREA OF PLANE FIGURES Exercise:TEST YOURSELF (SHORT -ANSWER QUESTIONS)
Explore 1 Video
Similar Questions
Knowledge Check
The median of the frequency distribution is
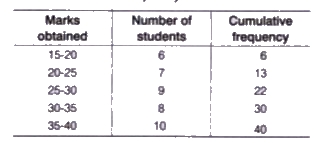 A28.88B30.88C35.88DNone of these
The median of the frequency distribution is
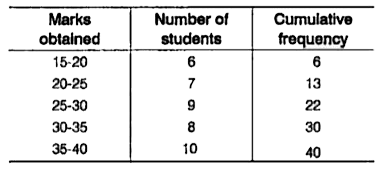 A28.88B30.88C35.88DNone of these
Read the frequency distribution table given below and answer the questions that follow:
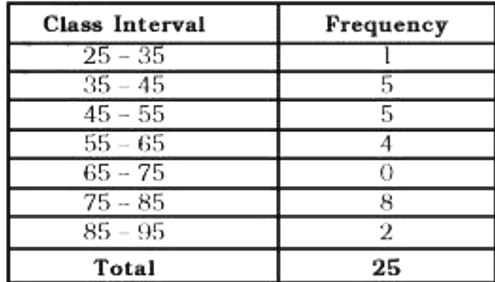
What is the class size of the intervals?
View SolutionRead the frequency distribution table given below and answer the questions that follow:
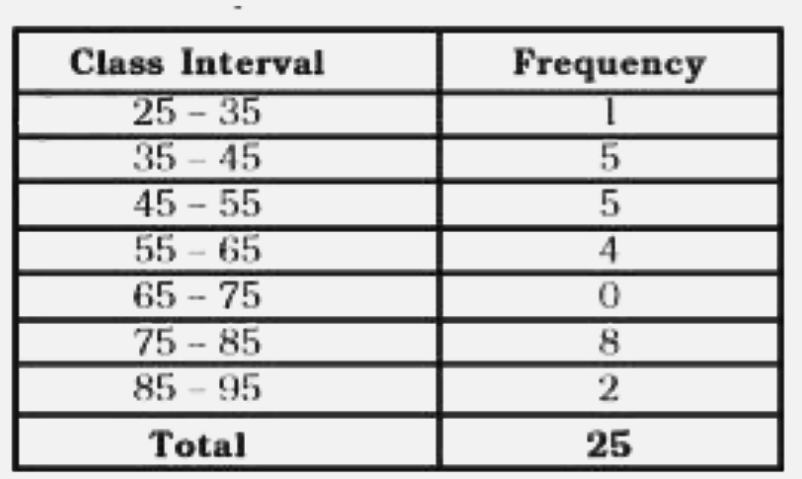
What is the upper limit of the fifth class?
View SolutionRead the frequency distribution table given below and answer the questions that follow:
What is the lower limit of the last class?
View SolutionThe distances covered by 250 pubic transport buses in a day is shown in the following frequency distribution table. Find the median of the distances.

View SolutionThe distances covered by 250 public transport buses in a day is shown in the following frequency distribution table. Find the median of the distances.

View SolutionConsider the following frequency distribution :
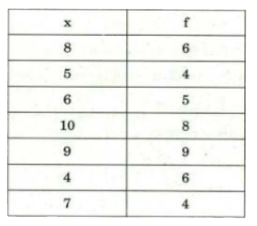
What is the median for the distribution?
View Solution
