Look at the cumulative frequency distribution table given below
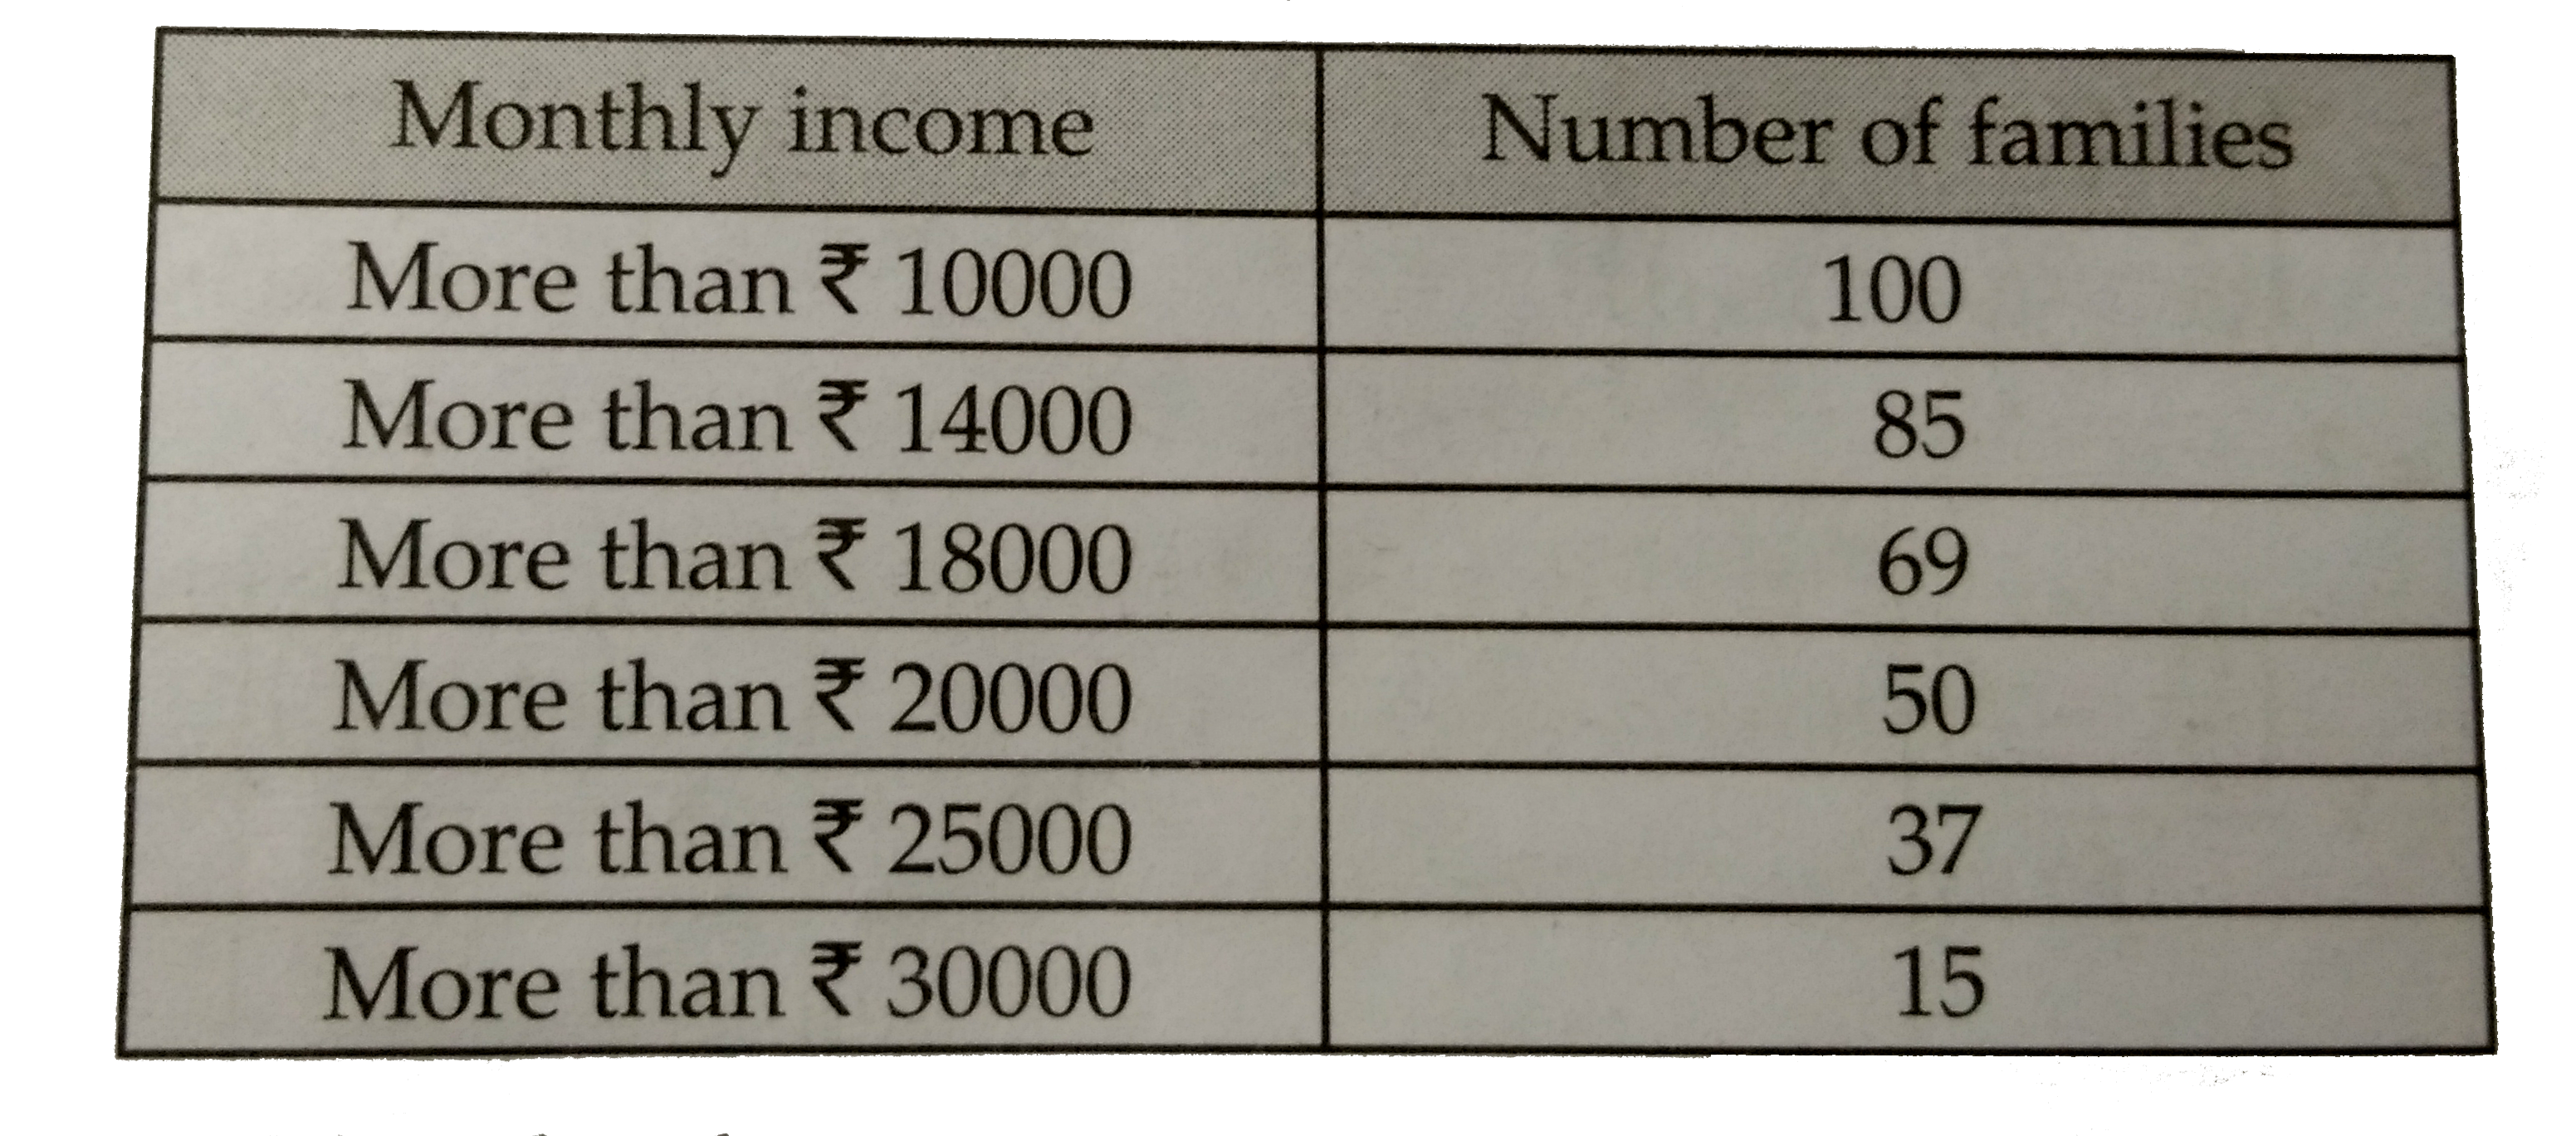
Number of families having income range 20000 to 25000 is
19
16
13
22
NA
Topper's Solved these Questions
- MEAN,MEDAN,MODE OF GROUPED,DATA CUMULATIVE FREQUENCY GRAPH AND OGIVE BOOK - RS AGGARWALCHAPTER - MEAN,MEDAN,MODE OF GROUPED,DATA CUMULATIVE FREQUENCY GRAPH AND OGIVE EXERCISE - Test Yourself
18 Videos
- MEAN,MEDAN,MODE OF GROUPED,DATA CUMULATIVE FREQUENCY GRAPH AND OGIVE BOOK - RS AGGARWALCHAPTER - MEAN,MEDAN,MODE OF GROUPED,DATA CUMULATIVE FREQUENCY GRAPH AND OGIVE EXERCISE - Multiple Choice Questions (Mcq)
23 Videos
- LINEAR EQUATIONS IN TWO VARIABLES BOOK - RS AGGARWALCHAPTER - LINEAR EQUATIONS IN TWO VARIABLES EXERCISE - QUESTION
2 Videos
- PERIMETER AND AREA OF PLANE FIGURES BOOK - RS AGGARWALCHAPTER - PERIMETER AND AREA OF PLANE FIGURES EXERCISE - TEST YOURSELF (SHORT -ANSWER QUESTIONS)
1 Videos
Similar Questions
Knowledge Check
An incomplete frequency distribution is given below
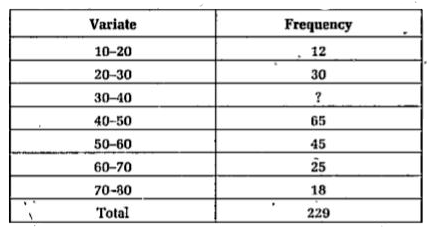
Median value is 46, the missing frequency isA33B35C34D26
Given below is a cumulative frequency distribution table showing the ages of people living in a locality: Age in years No. of persons Above 108 Above 96 Above 84 Above 72 Above 60 Above 48 Above 36 Above 24 Above 12 Above 0 0 1 3 5 20 158 427 809 1026 1024 Prepare a frequency distribution table
View SolutionRead the frequency distribution table given below and answer the questions that follow:
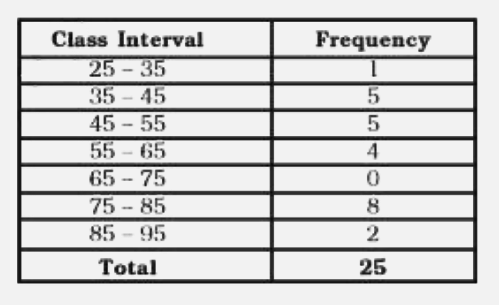
Class interval which has the highest frequency.
View SolutionRead the frequency distribution table given below and answer the questions that follow:
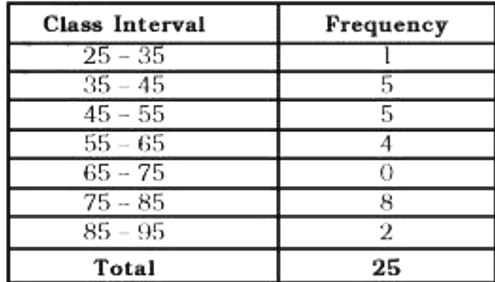
What is the class size of the intervals?
View SolutionRead the frequency distribution table given below and answer the questions that follow:
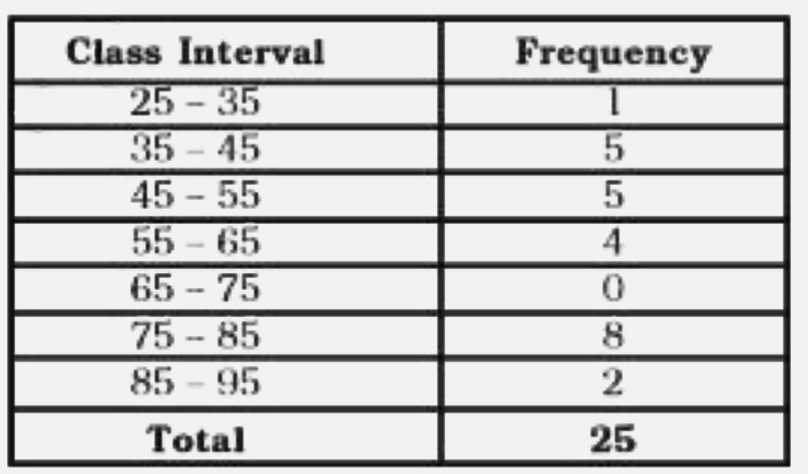
What is the upper limit of the fifth class?
View SolutionRead the frequency distribution table given below and answer the questions that follow:
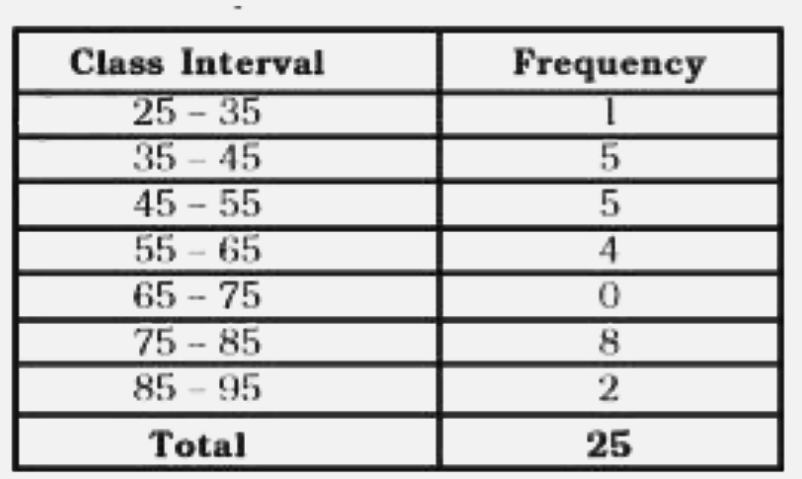
What is the lower limit of the last class?
View SolutionA cumulative frequency distribution is given below. Convert this into a frequency distribution table. Marks Below 45 Below 60 Below 75 Below 90 Below 105 Below 120 No. of Students 0 8 23 48 85 116
View SolutionRead the frequency distribution table given below and answer the questions that follow:
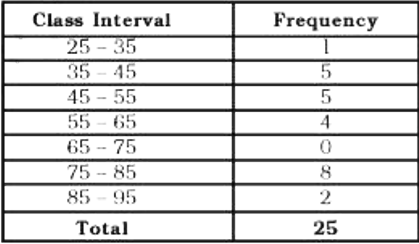
Class interval which has the lowest frequency.
View Solution

