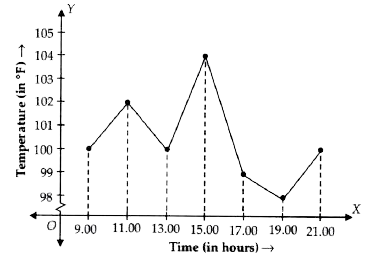
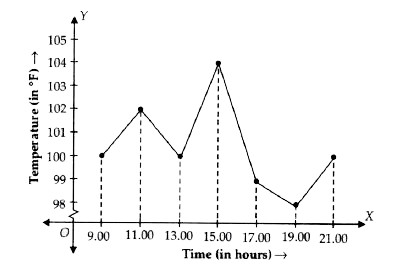
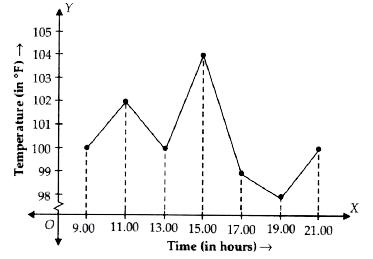
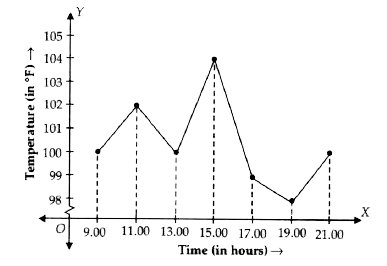
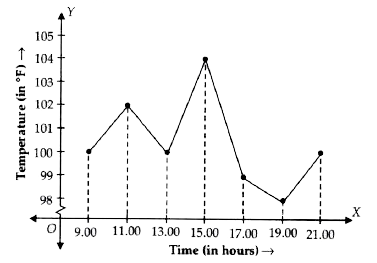
Observe the graph and answer the following questions.
The temperature of the patient at 11.00 hours is
A
99∘ F
B
102∘ F
C
98∘ F
D
106∘F
Video Solution
Text Solution
The correct Answer is:B
|
Answer
Step by step video & image solution for Observe the graph and answer the following questions. The temperature of the patient at 11.00 hours is by Maths experts to help you in doubts & scoring excellent marks in Class 8 exams.
Updated on:21/07/2023Topper's Solved these Questions
- INTRODUCTION TO GRAPHS BOOK - MTG IIT JEE FOUNDATIONCHAPTER - INTRODUCTION TO GRAPHS EXERCISE - EXERCISE (Multiple Choice Question) (Level-2)
8 Videos
- INTRODUCTION TO GRAPHS BOOK - MTG IIT JEE FOUNDATIONCHAPTER - INTRODUCTION TO GRAPHS EXERCISE - EXERCISE (MATCH THE FOLLOWING
2 Videos
- INTRODUCTION TO GRAPHS BOOK - MTG IIT JEE FOUNDATIONCHAPTER - INTRODUCTION TO GRAPHS EXERCISE - NCERT SECTIONS (15.3)
4 Videos
- FOOTSTEPS TOWARDS JEE MAINBOOK - MTG IIT JEE FOUNDATIONCHAPTER - FOOTSTEPS TOWARDS JEE MAINEXERCISE - Section B (Numerical Value Type Questions)
9 Videos
- LINEAR EQUATIONS IN ONE VARIABLEBOOK - MTG IIT JEE FOUNDATIONCHAPTER - LINEAR EQUATIONS IN ONE VARIABLEEXERCISE - Olympiad/HOTS Corner
15 Videos
Similar Questions
Knowledge Check
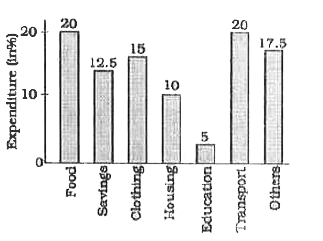
The bar graph given below shows the spending of a family income on various items and savings during 1993. Observe the graph and answer the following questions :
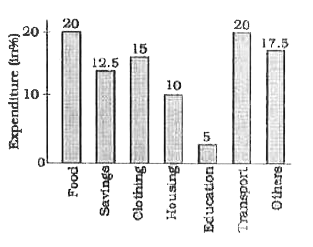
The percent of income spent on food is :A5B10C12.5D20The bar graph given below shows the spending of a family income on various items and savings during 1993. Observe the graph and answer the following questions :
The total expenses of the family on transport are equal to those spent on :AsavingsBclothingCfoodDothersThe bar graph given below shows the spending of a family income on various items and savings during 1993. Observe the graph and answer the following questions :
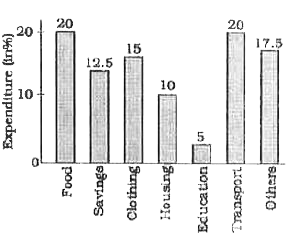
The percent of income spent on clothing exceeds that on savings by :A12.5%B20%C10%D22.5%
Observe the graph and answer the following questions.
The temperature is minimum at
View SolutionObserve the figure and answer the following question.
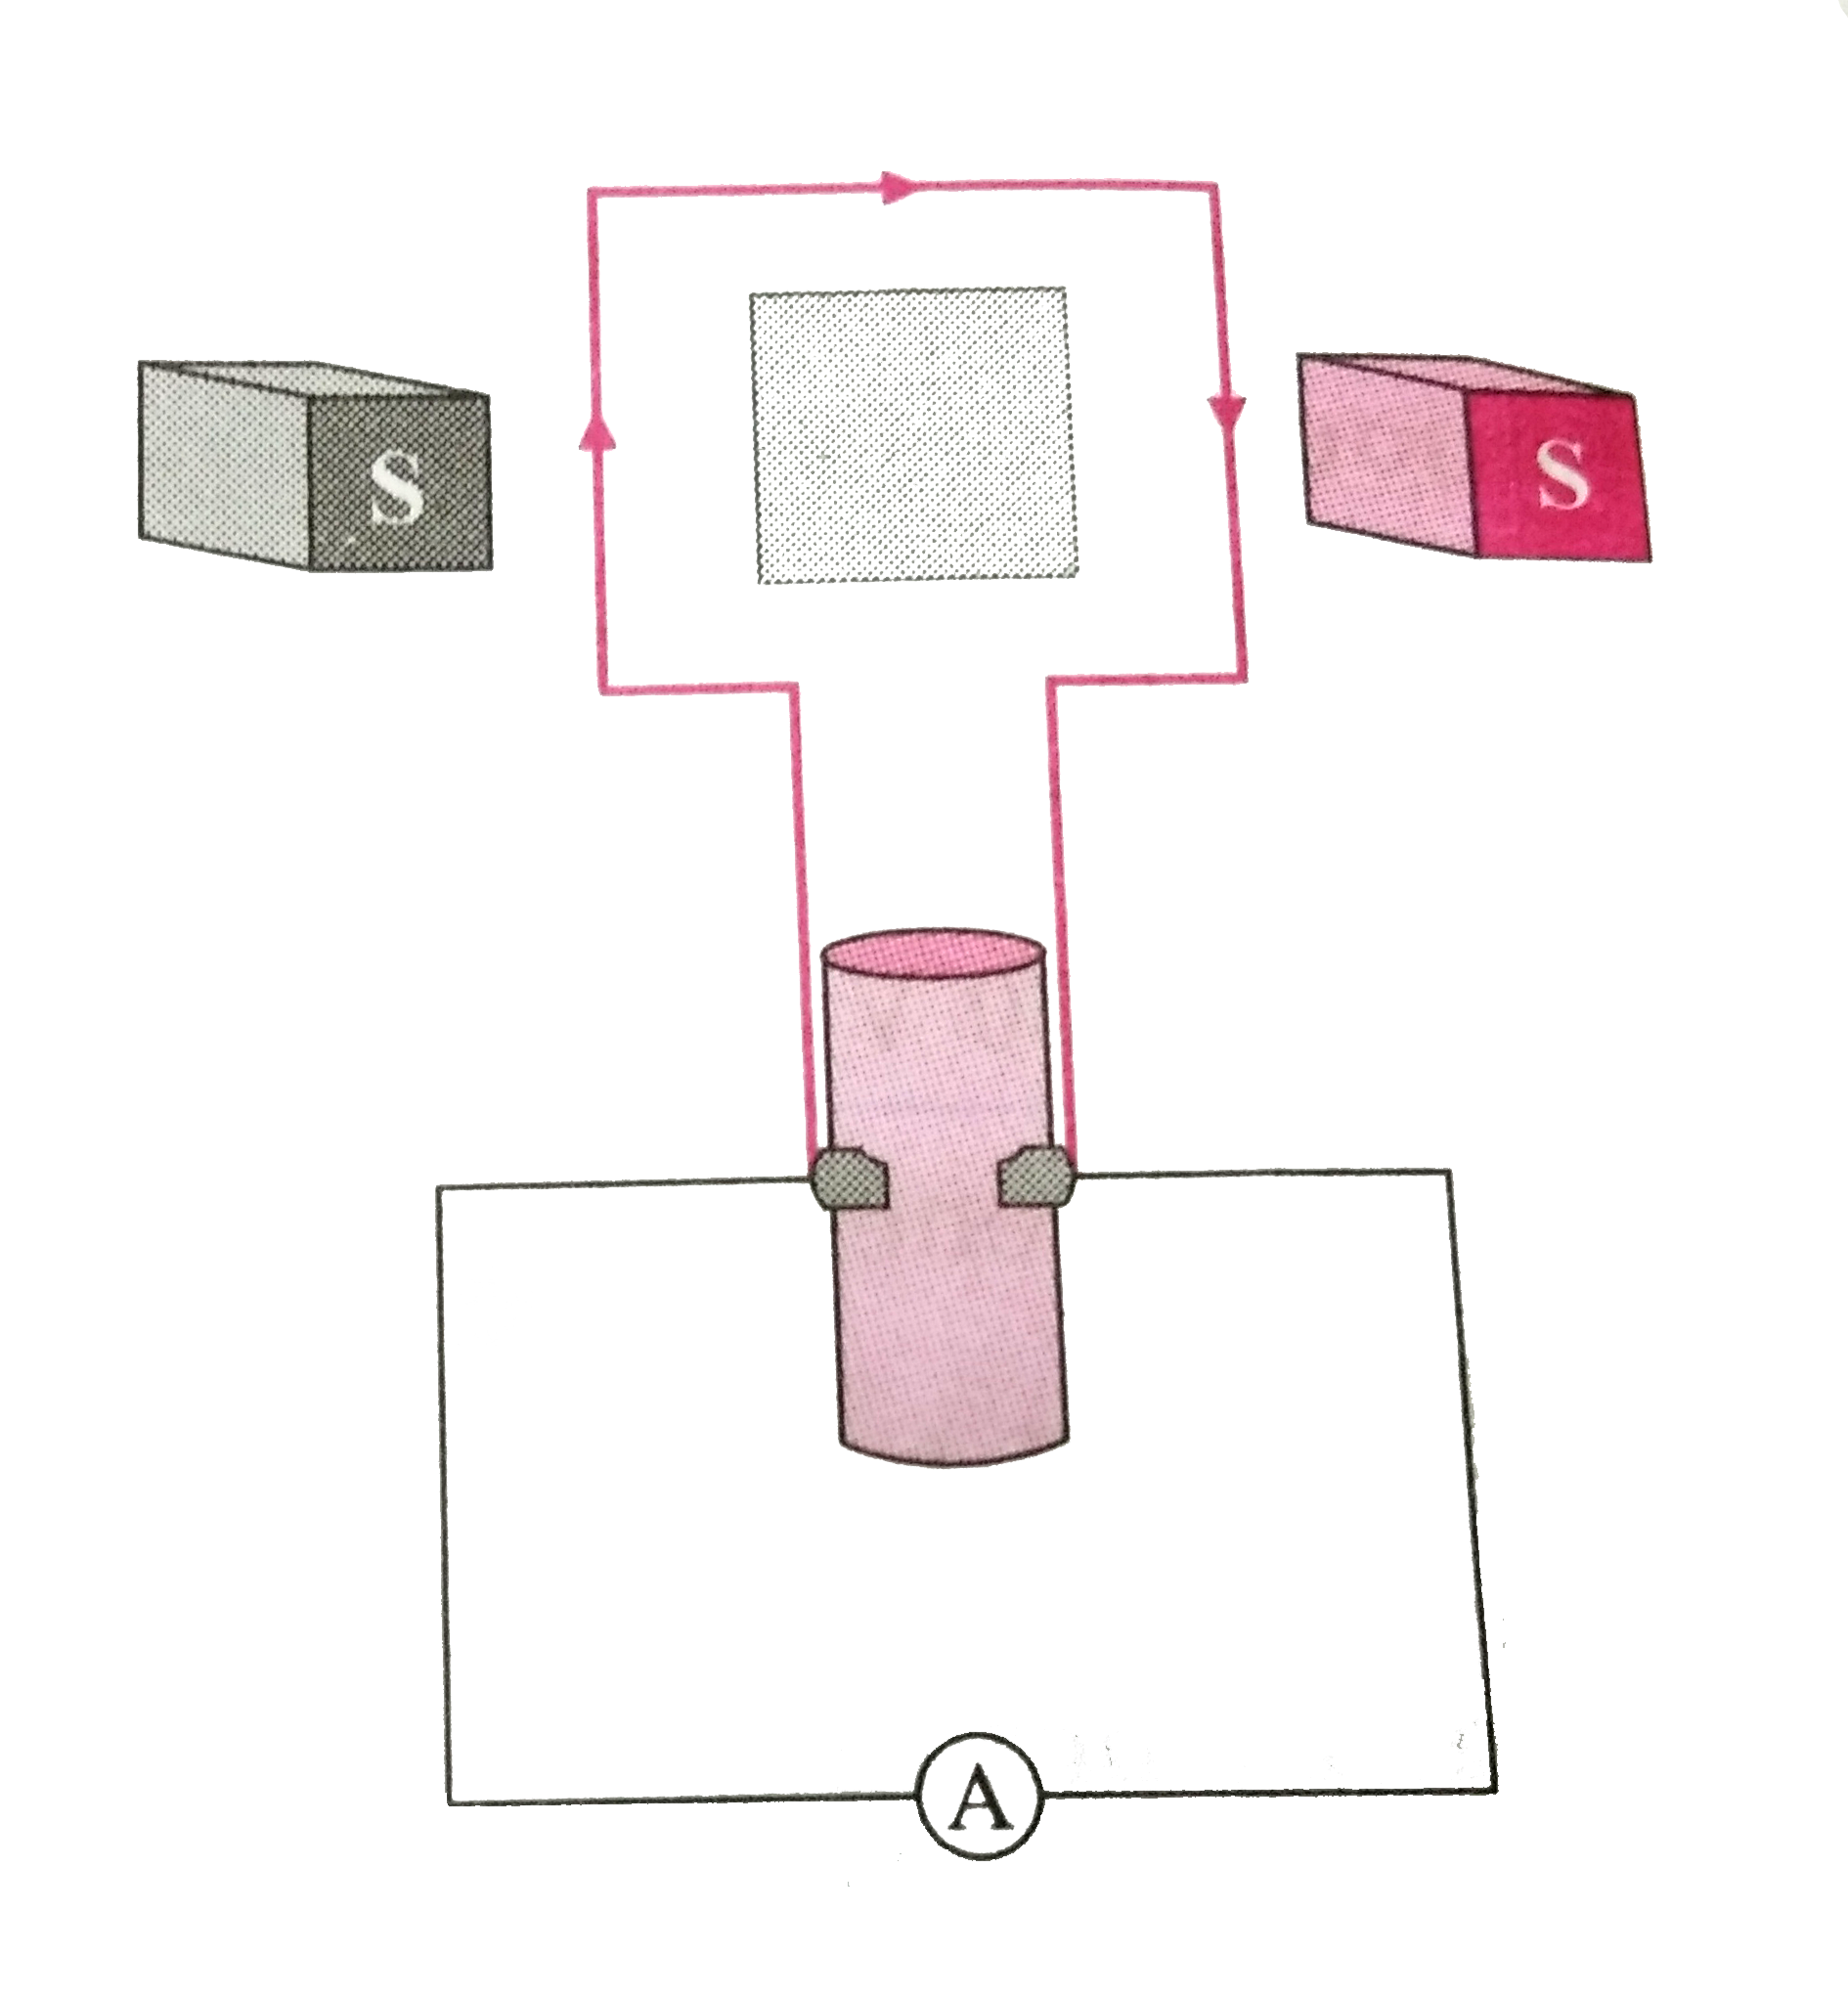
Write a use of this machine .
View SolutionObserve the graph and answer the following questions.
The information given by the graph is:
View SolutionRead the graph and answer the following questions
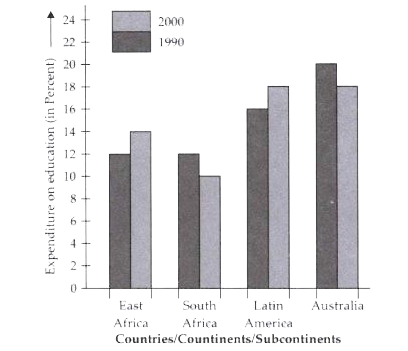
Give a suitable title to bar graph
View SolutionObserve the following reaction and answer the following questions :

The structure of Q1 is :
View Solution
