Read the graph and answer the following questions
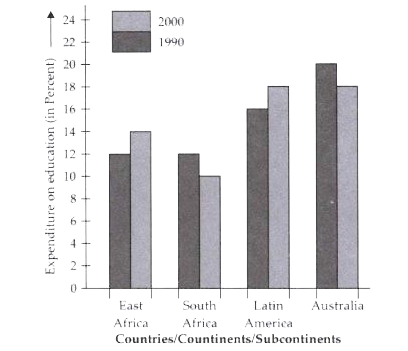
Give a suitable title to bar graph
The correct Answer is:Expenditure of education in four countries
Step by step video, text & image solution for Read the graph and answer the following questions Give a suitable title to bar graph by Maths experts to help you in doubts & scoring excellent marks in Class 7 exams.
Updated on:21/07/2023Topper's Solved these Questions
- DATA HANDLINGBOOK - MTG IIT JEE FOUNDATIONCHAPTER - DATA HANDLINGEXERCISE - NCERT Section (Exercise - 3 .1 )
23 Videos
- DATA HANDLINGBOOK - MTG IIT JEE FOUNDATIONCHAPTER - DATA HANDLINGEXERCISE - NCERT Section (Exercise - 3 .2 )
9 Videos
- DATA HANDLINGBOOK - MTG IIT JEE FOUNDATIONCHAPTER - DATA HANDLINGEXERCISE - Olympiad / Hots Corner
20 Videos
- CONGRUENCE OF TRIANGLES BOOK - MTG IIT JEE FOUNDATIONCHAPTER - CONGRUENCE OF TRIANGLES EXERCISE - Olympiad/HOTS Corner
10 Videos
- EXPONENTS AND POWERSBOOK - MTG IIT JEE FOUNDATIONCHAPTER - EXPONENTS AND POWERSEXERCISE - OLYMPIAD/HOTS CORNER
15 Videos
Similar Questions
Number of wrist watches manufactured by a factory in six days of a particular week is given below.
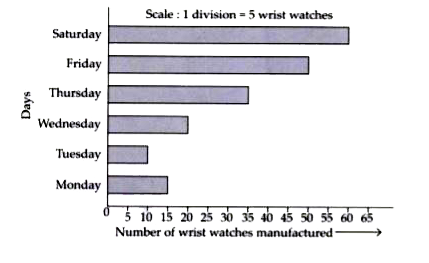
Read the bar graph and answer the following questions.
What information does the bar graph gives ?
View SolutionThe following bar graph shows the number of vehicles passing through a road crossing in Delhi in different time intervals on a particular day. Read the bar graph and answer the following questions: What does the bar graph represent? Also, give the maximum number of vehicles. When is the hourly traffic maximum? Also give the minimum number of vehicles. When is the hourly traffic minimum? What is the total number of vehicles passing through a crossing during a particular day?
View Solution
Knowledge Check
The following graph gives Sales, Expenses and Capital of a company for a period of five years 1994 to 1998. Read the graph and answer the following questions.
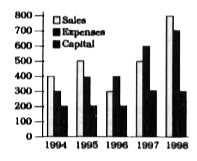
In which year was the Sales to Expense ratio the lowest?A1994B1996C1997D1998The bar graph shows the number of males and females (in crores) in india during 1951-1991. Read the graph and answer the following questions
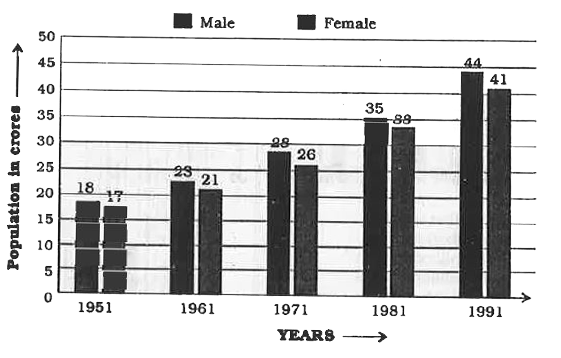
What was the approximate number of males in India in 1971 per thousands females ?A913B1075C1077D1175The following graph gives Sales, Expenses and Capital of a company for a period of five years 1994 to 1998. Read the graph and answer the following questions.
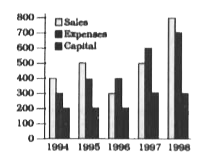
In which year was the ratio of profit to capital the highest?A1998B1995C1996D1997
Read the graph and answer the following questions
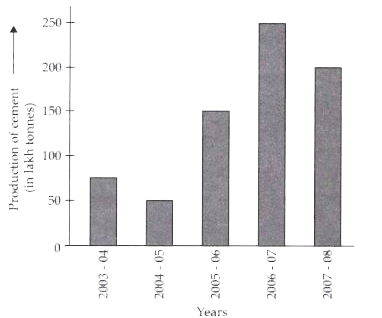
What information is conveyed by the bar graph
View SolutionThe following bar graph represents the data for different sizes of shoes worn by the students in a school. Read the graph and answer the following questions.
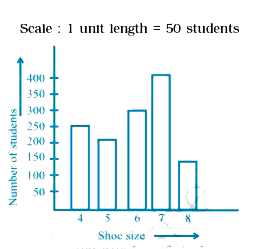
What is the number of students wearing shoe size 6?
View SolutionThe following bar graph represents the data for different sizes of shoes worn by the students in a school. Read the graph and answer the following questions.
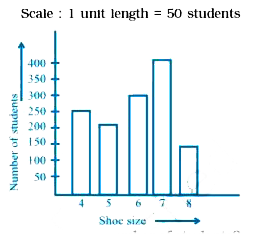
Which shoe size is worn by the maximum number of students?
View SolutionThe following bar graph shows the number of houses (out of 100) in a town using different types of fuels for cooking.
Read the bar graph and answer the following questions:
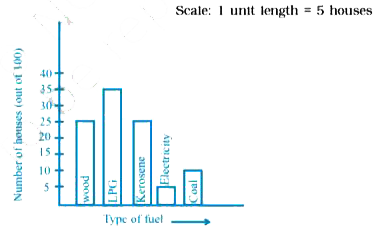
Suppose that the total number of houses in the town is 1 lakh. From the above graph estimate the number of houses using electricity.
View SolutionThe following graph gives Sales, Expenses and Capital of a company for a period of five years 1994 to 1998. Read the graph and answer the following questions.
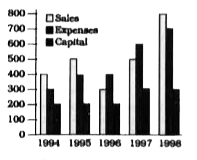
In which years was the ratio of sales tom capital the lowest ?
View Solution
