Read the bar graph and answer the following questions.
In which year the difference of the values of export and import is maximum?
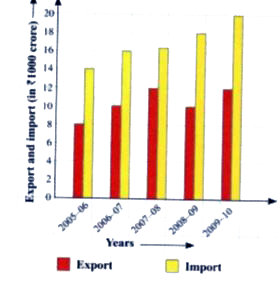
Step by step video & image solution for Read the bar graph and answer the following questions. In which year the difference of the values of export and import is maximum? by Maths experts to help you in doubts & scoring excellent marks in Class 7 exams.
Updated on:21/07/2023Topper's Solved these Questions
- PROBABILITYBOOK - ICSECHAPTER - PROBABILITYEXERCISE - TRY THIS
14 Videos
- PROBABILITYBOOK - ICSECHAPTER - PROBABILITYEXERCISE - UNIT PRATICE PAPER VI (FILL IN THE BLANKS)
5 Videos
- PERIMETER AND AREA BOOK - ICSECHAPTER - PERIMETER AND AREA EXERCISE - TRY THIS
41 Videos
- PROFIT AND LOSS BOOK - ICSECHAPTER - PROFIT AND LOSS EXERCISE - EXERCISE 10
18 Videos
Similar Questions
Read the bar graph and answer the following questions.
in which year the value of the export is greater than that of the import?
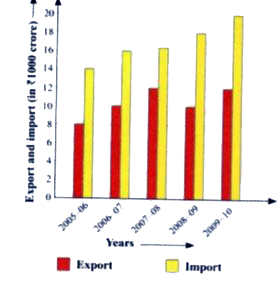
View SolutionRead the following bar graph and answer the following questions: What information is given by the bar graph? In which year the export is minimum ? In which year the import is maximum ? In which year the difference of the values of export and import is maximum?
View SolutionObserve the bar graph given below :
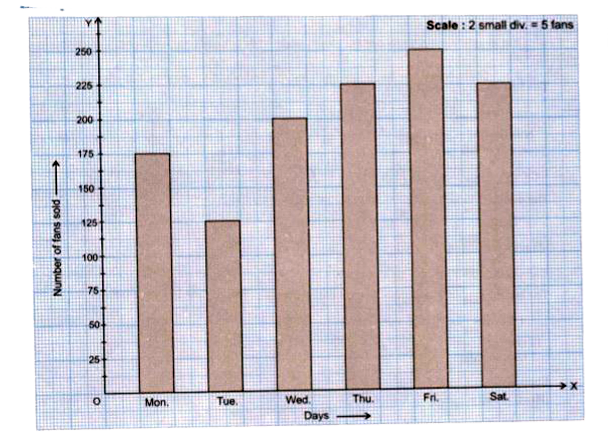
Read the bar graph carefully and answer the following questions :
On which day of the week was the sale maximum?
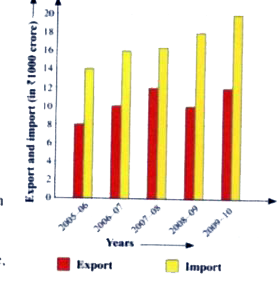
View SolutionRead the bar graph and answer the following questions.
What information is given by the bar graph?
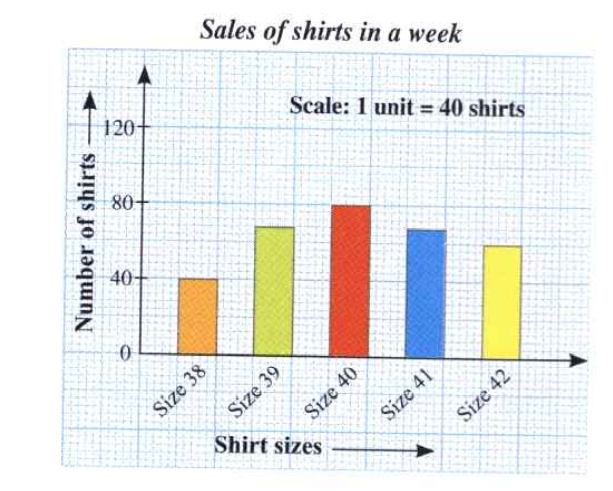
View SolutionRead the following graph and answer the following question.
What are the different sizes of shirts that are sold?
View SolutionThe following graph gives the minimum and maximum temperatures of various cities on a specific day. Read the graph and answer the following questions
Which city has the largest difference between the minimum and the maximum temperatures on the given day?
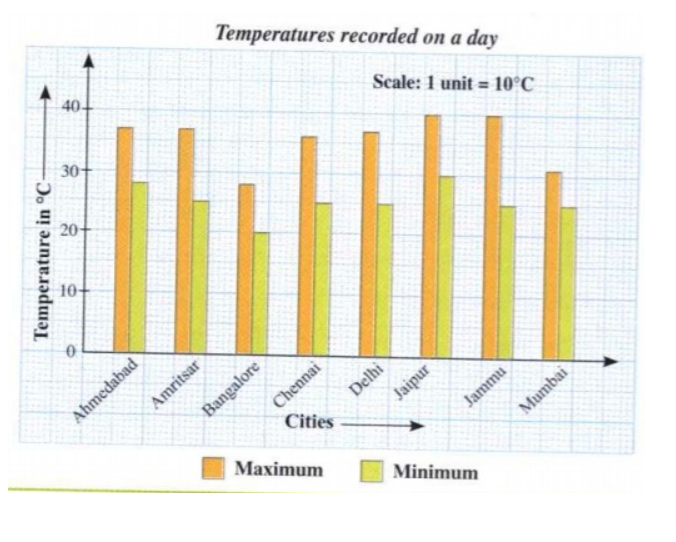
View SolutionThe following graph gives the minimum and maximum temperatures of various cities on a specific day. Read the graph and answer the following questions
Name the city which has the minimum difference between its minimum and maximum temperatures.

View SolutionThe following bar graph represents the data for different sizes of shoes worn by the students in a school. Read the graph and answer the following questions.
(i)What are the different numbers of the shoe-worn by the students?
(ii)What is the number of students wearing shoe No. 6?
(iii)Which shoe number is worn by the maximum number of students?
(iv)Which shoe number is worn by the minimum number of students?
View SolutionDraw a bar graph from the following data:

View SolutionAnswer the following questions :
What is the difference between aqueous and alcoholic KOH ?
View Solution
