The following bar graph represents the data for different sizes of shoes worn by the students in a school. Read the graph and answer the following questions.
(i)What are the different numbers of the shoe-worn by the students?
(ii)What is the number of students wearing shoe No. 6?
(iii)Which shoe number is worn by the maximum number
of students?
(iv)Which shoe number is worn by the minimum number of students?
Step by step video & image solution for The following bar graph represents the data for different sizes of shoes worn by the students in a school. Read the graph and answer the following questions. (i)What are the different numbers of the shoe-worn by the students? (ii)What is the number of students wearing shoe No. 6? (iii)Which shoe number is worn by the maximum number of students? (iv)Which shoe number is worn by the minimum number of students? by Maths experts to help you in doubts & scoring excellent marks in Class 6 exams.
Updated on:21/07/2023Topper's Solved these Questions
Similar Questions
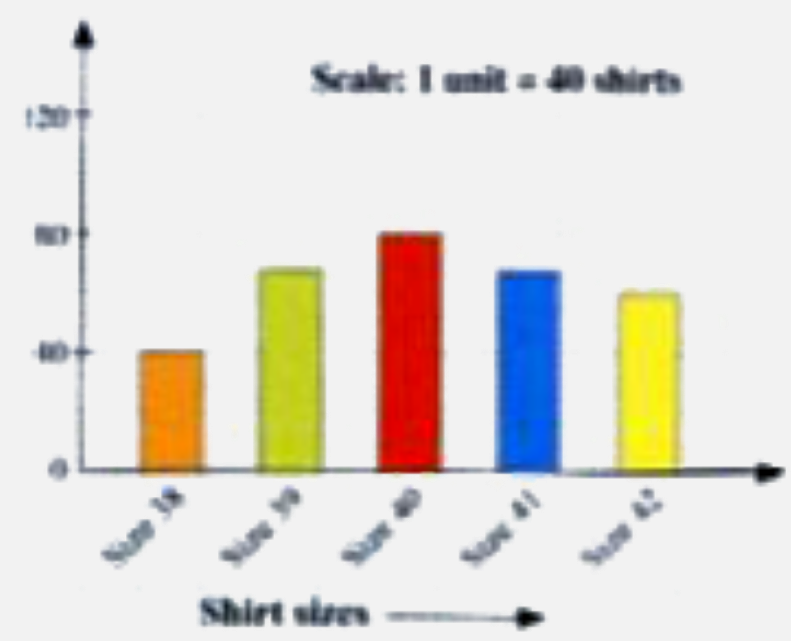
Read the following graph and answer the following question.
Find the ratio of the number of shirts of size 38 sold to the number of shirts of size 42 sold.

View SolutionThe following pie-chart shows the number of students admitted in different feculties of a college. If 1000 students are admitted in Science answer the following:
(i) What is the total number of students?
(ii) What is the ratio of students in science and arts?
View SolutionThe following bar graph (Figure) represents the heights (in cm) of 50 students of Class XI of a particular school. Study the graph and answer the following questions: What percentage of the total number of students have their heights more than 149 cm? How many students in the class are in the range of maximum height of the class? The school wants to provide a particular type of tonic to each student below the height of 150cm to improve his height. If the cost of the tonic for each student comes out to be Rs. 55, how much amount of money is required? How many students are in the range of shortest height of the class? State whether true or false: There are 9 students in the class whose heights are in the range of 155-159 cm. Maximum height (in cm) of a student in the class is 17. There are 29 students in the class whose heights are in the range of 145-154 cm. Minimum height (in cm) of a student is the class is in the range of 140-144cms. The number of students in the class having their heights less than 150cm is 12. There are 14 students each of whom has height more than 154 cm.
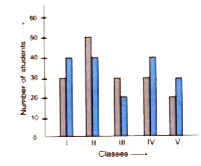
View SolutionExmine the given graph carefully.

In the graph show above represents the number of girls in a particular class and represents the number of boys in the same class.
Read and answer the following questions.
(i) Which class has the least number of students ?
(ii) Which class has maximum number of students ?
(iii) What is the ratio between the number of girls and the number of boys of class V.
View SolutionTotal number of students of a school in different years is shown in the following table
View SolutionRead the adjoining bar graph showing the number ofstudents in a particular class of a school. Answer thefollowing questions :(a) What is the scale of this graph?(b) How many new students are added every year?(c) Is the number of students in the year 2003 twice that in the year 2000?
View SolutionThe following bar graph shows the number of vehicles passing through a road crossing in Delhi in different time intervals on a particular day. Read the bar graph and answer the following questions: What does the bar graph represent? Also, give the maximum number of vehicles. When is the hourly traffic maximum? Also give the minimum number of vehicles. When is the hourly traffic minimum? What is the total number of vehicles passing through a crossing during a particular day?
View SolutionThe following pie-chart represents the total number of valid votes obtained by four students who contested for school leadership. The total number of valid votes polled was 720. Answer the following questions by reading the pie-chart.
View SolutionThe following table shows the favourite sports of 250 students of a school. Represent the data by a bar graph.
View SolutionLook at the bar graph given below.
Read it care fully and answer the following questions.
(i) What information does the bar graph give?
(ii) In which subject is the student very good?
(iii) In which subject is the poor? (iv) What is the average of his marks?
View Solution
