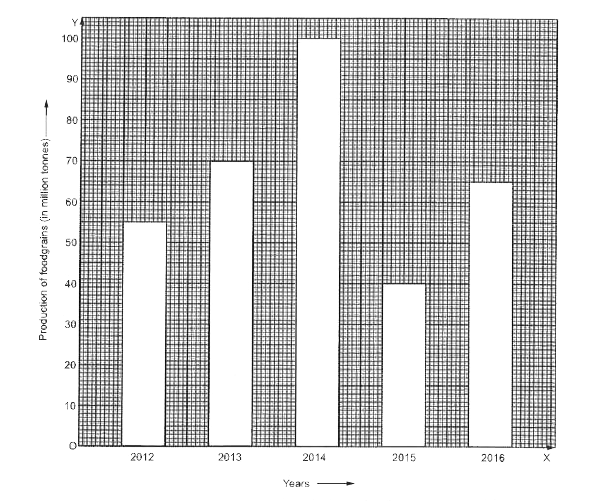
Read the bar graph given below which shows production of food grains in an Indian state during 5 consecutive years and answer the questions that follows :
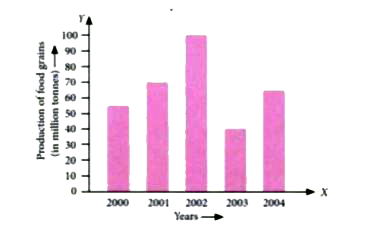
After which year, was there a sudden fall in the production ?
Step by step video & image solution for Read the bar graph given below which shows production of food grains in an Indian state during 5 consecutive years and answer the questions that follows : After which year, was there a sudden fall in the production ? by Maths experts to help you in doubts & scoring excellent marks in Class 9 exams.
Updated on:21/07/2023Topper's Solved these Questions
- FOOTSTEPS TOWARDS CBSE BOARDBOOK - MTG IIT JEE FOUNDATIONCHAPTER - FOOTSTEPS TOWARDS CBSE BOARDEXERCISE - PART-A (SECTION-II)
16 Videos
- FOOTSTEPS TOWARDS CBSE BOARDBOOK - MTG IIT JEE FOUNDATIONCHAPTER - FOOTSTEPS TOWARDS CBSE BOARDEXERCISE - PART-B (SECTION-III)
17 Videos
- FOOTSTEPS TOWARDS (JEE MAIN)BOOK - MTG IIT JEE FOUNDATIONCHAPTER - FOOTSTEPS TOWARDS (JEE MAIN)EXERCISE - Section B (Numerical Value Type Questions)
10 Videos
- HERON'S FORMULABOOK - MTG IIT JEE FOUNDATIONCHAPTER - HERON'S FORMULAEXERCISE - OLYMPIAD/HOTS CORNER
7 Videos
Similar Questions
Read the bar graph which shows the number of books sold by a bookstore during five consecutive years and answer the following questions
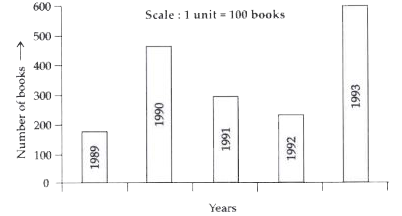
In which years were fewer than 200 books sold ?
View SolutionRead the bar graph which shows the number of books sold by a bookstore during five consecutive years and answer the following questions
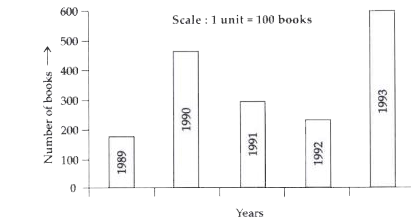
In which year highest books were sold ?
View Solution
Knowledge Check
The given bar graph shows the biscuit exports of India over a period of five years. Study the graph and answer the questions that follows
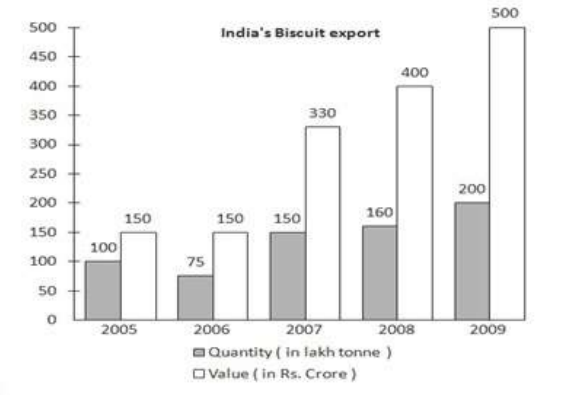
In which two year was the value per tonne equal?A2006 and 2007B2008 and 2009C2007 and 2008D2005 and 2006Study the following graph carefully and answer the questions that
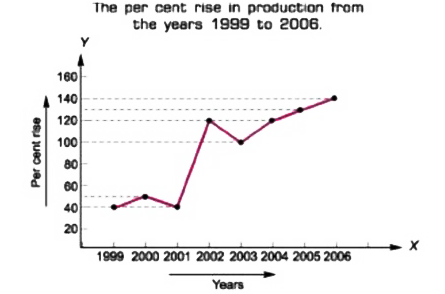
If the production in year 1998 was 1000 units , how much was the production in year 2002 ?A35280 unitsB64680 unitsC46200DNone of these
Read the bar graph given below
Read the bar graph carefully and answer the following questions
Q(i) What information is given by the bar graph
(ii) In which year was the production maximum
(iii) After which year was there a sudden fall in the production
(iv) Find the ratio between the maximum production and the minimum production during the given period
View SolutionRead the bar graph which shows the number of books sold by a bookstore during five consecutive years and answer the following questions
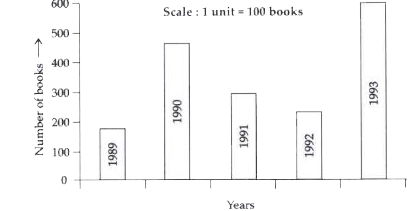
In which year lowest books were sold ?
View SolutionRead the bar graph which shows the number of books sold by a bookstore during five consecutive years and answer the following questions
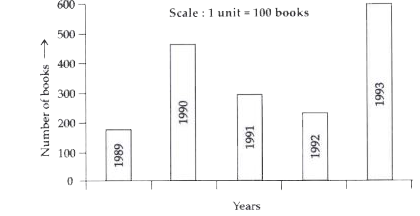
Can you give an appropriate name to the bar graph shown above ?
View SolutionThe following table shows the productions of food-grains (in million tons) in a state for the period 1999-2000 to 2003-2004. Read the table and answer the questions
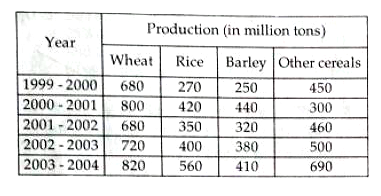
In the year 2003-2004, the increase in production was maximum over the previous year for
View SolutionStudy the bar graph given below and answer the questions that follow.
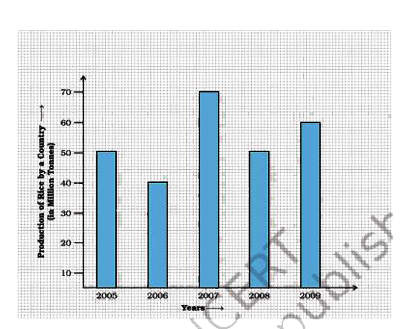
(a) What information does the above bar graph represent?
(b) In which year was production the least?
(c) After which year was the maximum rise in the production?
(d) Find the average production of rice during the 5 years.
(e) Find difference of rice production between years 2006 and 2008.
View SolutionRead the following graph carefully and answer the questions given below:
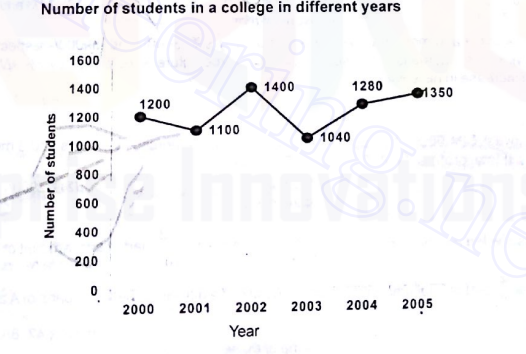
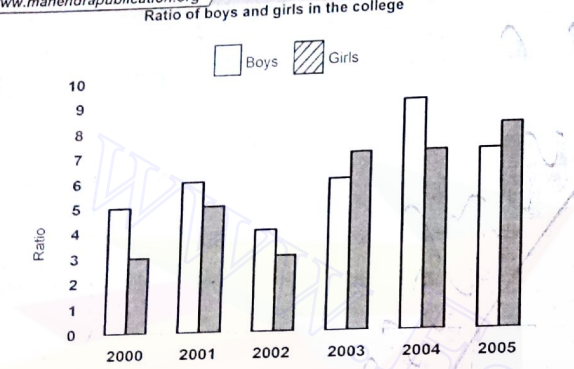
In which two years the number of girls is equal ?
View Solution
