Read the bar graph which shows the number of books sold by a bookstore during five consecutive years and answer the following questions
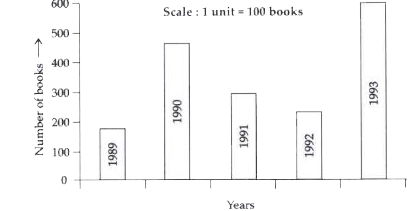
In which year lowest books were sold ?
The correct Answer is:1989
Step by step video, text & image solution for Read the bar graph which shows the number of books sold by a bookstore during five consecutive years and answer the following questions In which year lowest books were sold ? by Maths experts to help you in doubts & scoring excellent marks in Class 7 exams.
Topper's Solved these Questions
- BOOK - MTG IIT JEE FOUNDATIONCHAPTER - DATA HANDLINGEXERCISE - NCERT Section (Exercise - 3 .4 )8videos
DATA HANDLING
- BOOK - MTG IIT JEE FOUNDATIONCHAPTER - DATA HANDLINGEXERCISE - Exercise (Level - 1) M.C.Q35videos
DATA HANDLING
- BOOK - MTG IIT JEE FOUNDATIONCHAPTER - DATA HANDLINGEXERCISE - NCERT Section (Exercise - 3 .2 )9videos
DATA HANDLING
- BOOK - MTG IIT JEE FOUNDATIONCHAPTER - CONGRUENCE OF TRIANGLES EXERCISE - Olympiad/HOTS Corner10videos
CONGRUENCE OF TRIANGLES
- BOOK - MTG IIT JEE FOUNDATIONCHAPTER - EXPONENTS AND POWERSEXERCISE - OLYMPIAD/HOTS CORNER15videos
EXPONENTS AND POWERS
Similar Questions
Read the bar graph which shows the number of books sold by a bookstore during five consecutive years and answer the following questions
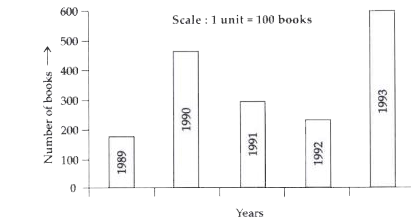
In which year highest books were sold ?View SolutionRead the bar graph which shows the number of books sold by a bookstore during five consecutive years and answer the following questions
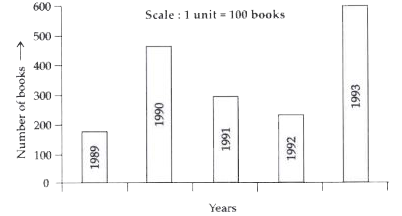
In which years were fewer than 200 books sold ?View SolutionRead the bar graph which shows the number of books sold by a bookstore during five consecutive years and answer the following questions

In which year lowest books were sold ?View SolutionRead the bar graph which shows the number of books sold by a bookstore during five consecutive years and answer the following questions
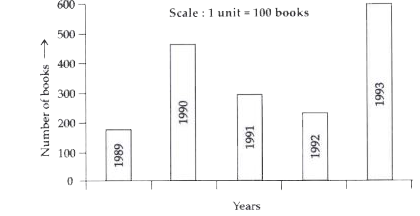
Can you give an appropriate name to the bar graph shown above ?View SolutionLook at the bar graph and answer the following questions.
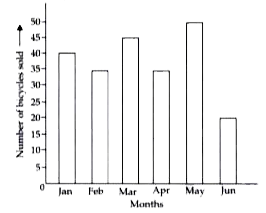
In which month 40 bicycles were sold?View SolutionRead the bar graph given below which shows production of food grains in an Indian state during 5 consecutive years and answer the questions that follows :
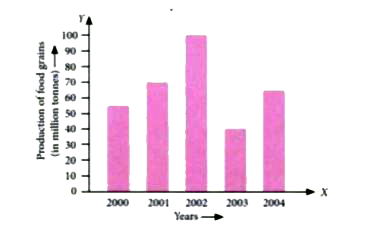
After which year, was there a sudden fall in the production ?View SolutionRead the bar graph (Fig 3.4) and answer the questions that follow:Number of books sold by a bookstore during five consecutive years.
(i) About how many books were sold in 1989? 1990? 1992?
(ii) In which year were about 475 books sold? About 225 books sold?
(iii) In which years were fewer than 250 books sold?
(iv) Can you explain how you would estimate the number of books sold in 1989?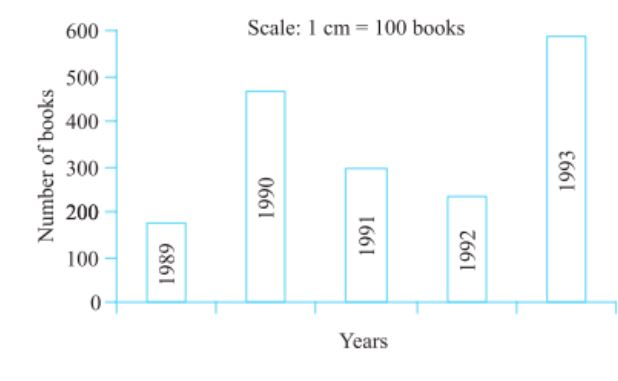 View Solution
The bar graph shows the number of cars of different brands sold by a dealer in a month. Study the diagram and answer the following question.
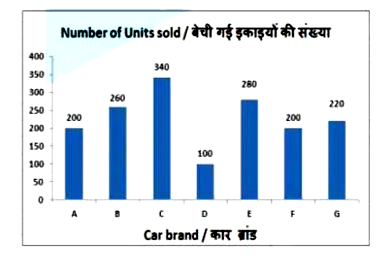
Units sold of which car brand were the second highest?View SolutionDirection: The given bar graph shows the number of pens sold by two shops A & B in four consecutive months. Study the following data and answer the following questions:
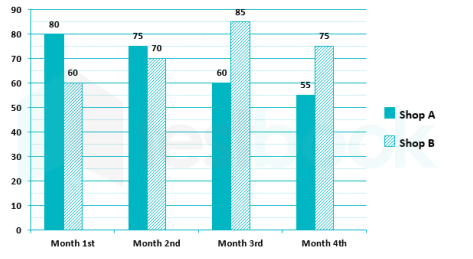
Find that the number of pens sold by shop A in 1st month is how much percent more than the number of pens sold by shop A in 3rd month.View SolutionRead the bar graph given below and answer the following questions:

In which year is the number of students maximum?View Solution

