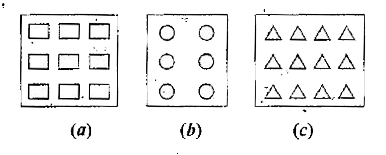
Shade : 13 of the rectangles in box (a)
(ii) 23 of the circles in box (b)
(iii) 12 of the triangles in box (c )
 Solution in Punjabi
Step by step video & image solution for Shade : (1)/(3) of the rectangles in box (a) (ii) (2)/(3) of the circles in box (b) (iii) (1)/(2) of the triangles in box (c ) by Maths experts to help you in doubts & scoring excellent marks in Class 7 exams.
Updated on:21/07/2023Topper's Solved these Questions
- FRACTIONS AND DECIMALSBOOK - SWAN PUBLICATIONCHAPTER - FRACTIONS AND DECIMALSEXERCISE - EXERCISE 2.3
21 Videos
- FRACTIONS AND DECIMALSBOOK - SWAN PUBLICATIONCHAPTER - FRACTIONS AND DECIMALSEXERCISE - EXERCISE 2.3 (Multiple choice questions)
3 Videos
- FRACTIONS AND DECIMALSBOOK - SWAN PUBLICATIONCHAPTER - FRACTIONS AND DECIMALSEXERCISE - EXERCISE 2.1 (Multiple Choice Questions :)
5 Videos
- EXPONENTS AND POWERS BOOK - SWAN PUBLICATIONCHAPTER - EXPONENTS AND POWERS EXERCISE - OTHER IMPORTANT QUESTIONS (TRUE FALSE)
8 Videos
- INTEGERSBOOK - SWAN PUBLICATIONCHAPTER - INTEGERSEXERCISE - OTHER IMPORTANT QUESTIONS (III. State whether the following statements are true or false : )
8 Videos
Similar Questions
Solve the following :
13 of
(a) 15 (b) 27 (c ) 32
View Solution14 of 83 is
View SolutionFractions 25,75 are
View SolutionWhich of the statement is true and which is false
If a any non zero rational number then a0=a.
View SolutionZero is an integer which is neither positive nor negative.
View SolutionDetermine the point of symmetry of a regular hexagon.
View SolutionDtermine the images of the following figure about the given line :
View SolutionMatch the following Column A to Column B

View SolutionMatch the following Column A to Column B

View SolutionMatch the following Column A to Column B

View SolutionThe area of the shaded part in the figure given below is ______.

View SolutionThe inequation represented by the graph given below is :
View SolutionThe inequation that best describes the graph given below is _________
View SolutionThe inequation that best describes the following graph is _________
View SolutionWhich inequations represent the shaded region in the given figure
View SolutionMatch the followings (column I with column II)
ltimg src="https://d10lpgp6xz60nq.cloudfront.net/physics_images/NCERT_BIO_XI_C03_E01_011_Q01.png" width="80%"gt
View Solution
