Sketch the curve |y|=(x−1)(x−2).Solution in Tamil
We have |y|=(x−1)(x−2)
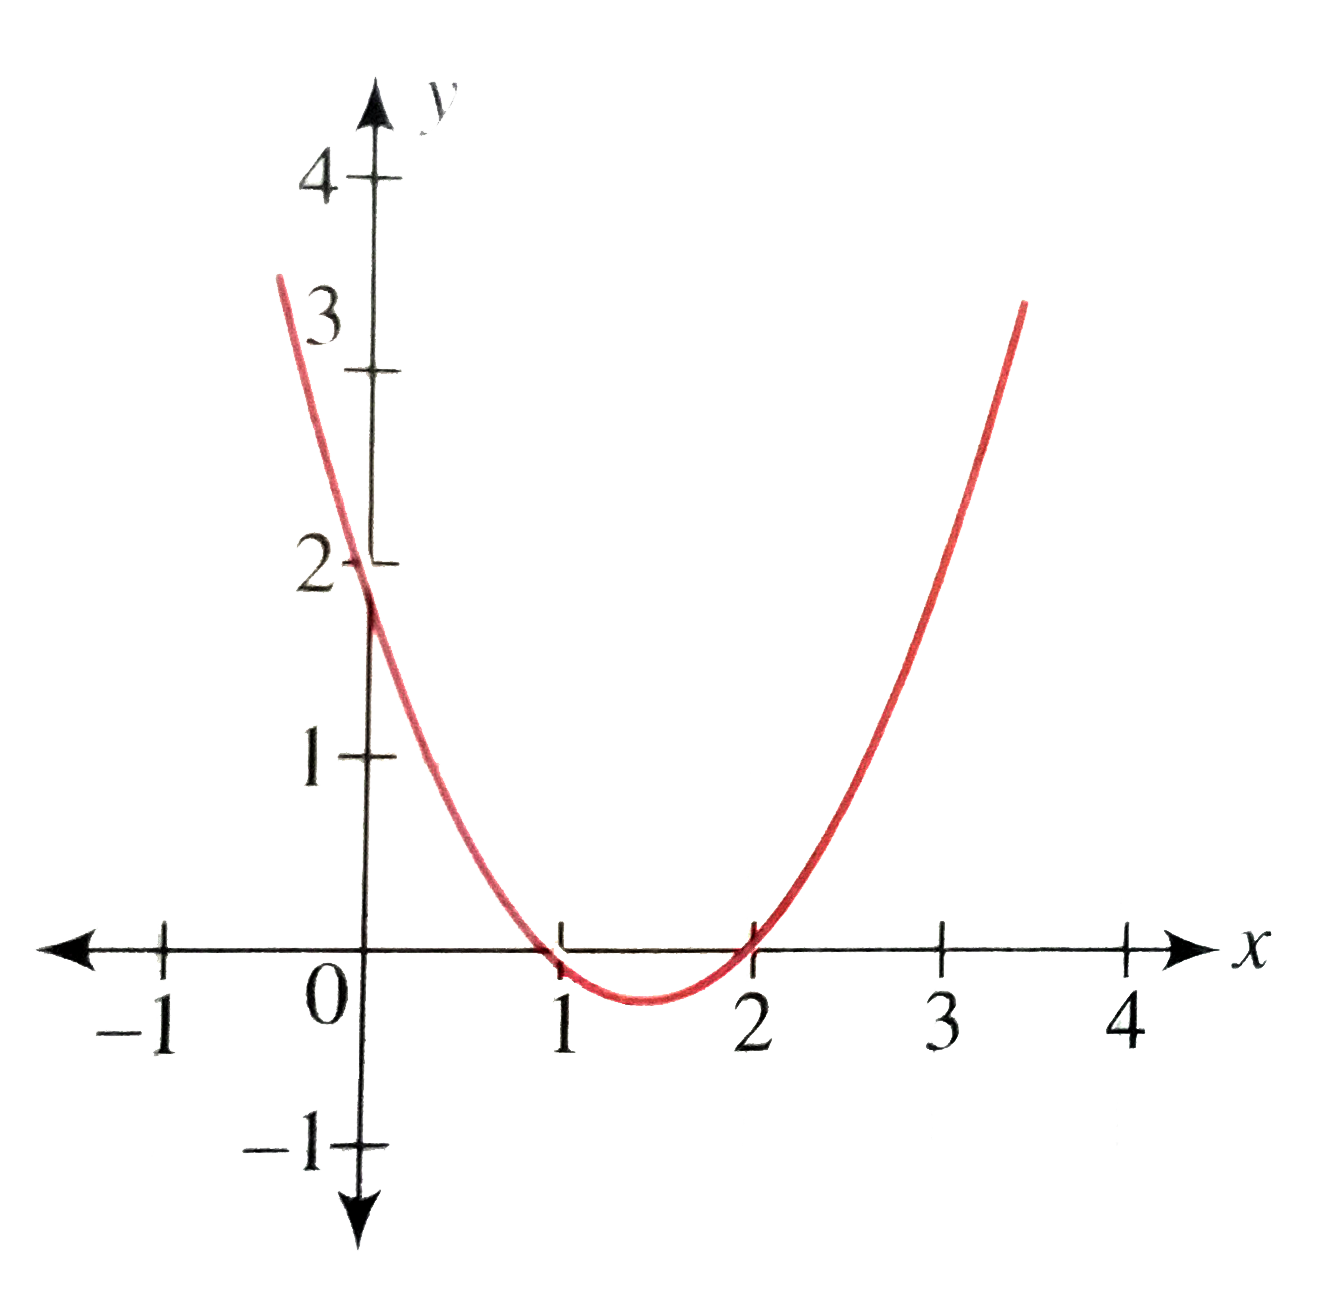
First draw the graph of y=(x−1)(x−2), which is an upward parabola intereting the x-aixs at (1,0) and (2,0).

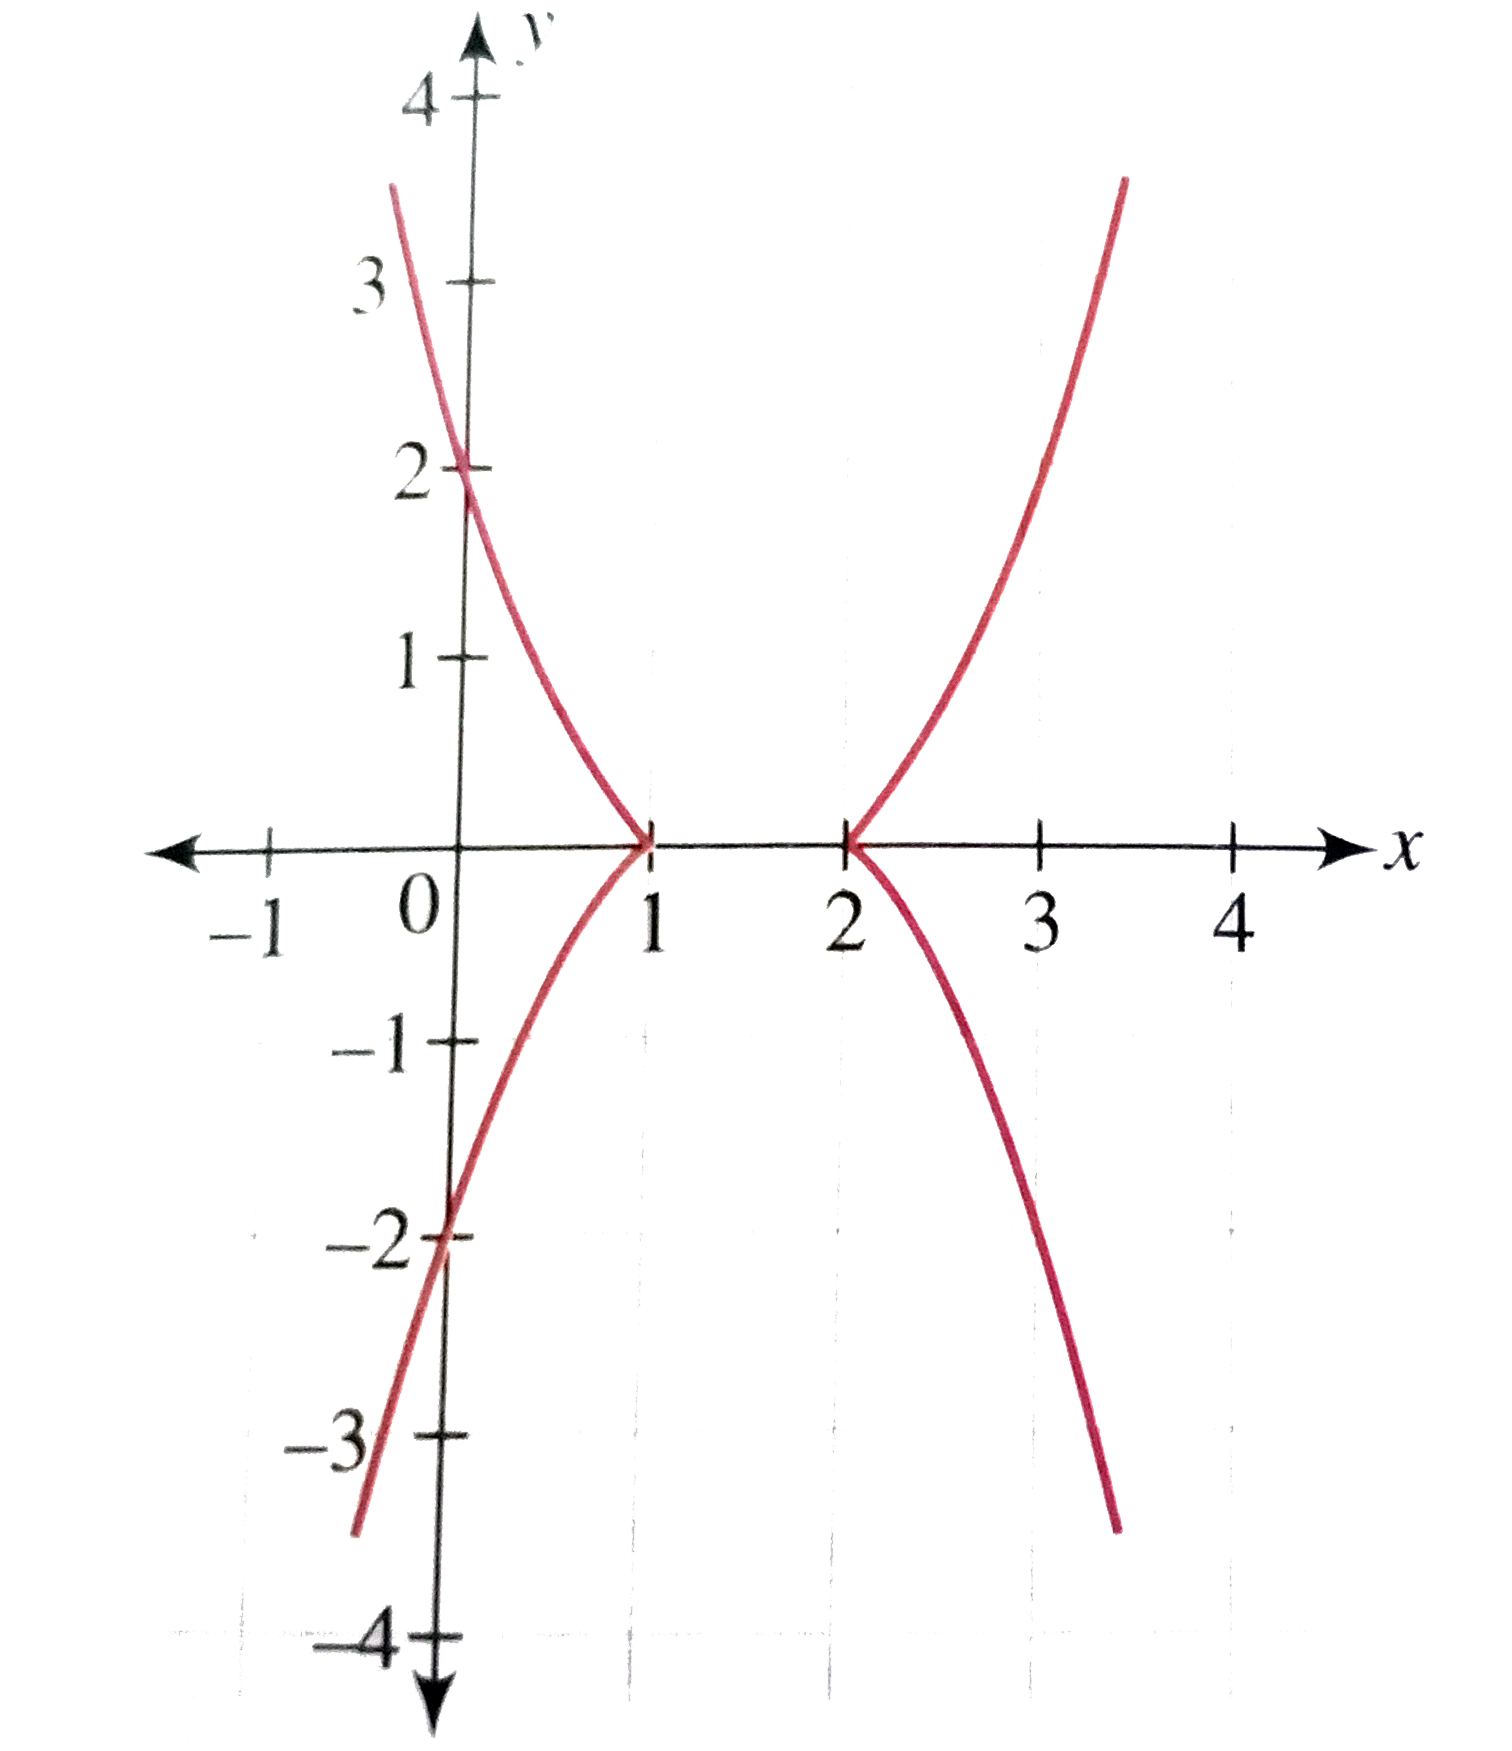
Now neglect the portion of the above graph for x∈(1,2). Consider the portion of the above graph for x≤1andx≥2. Reflect this portion of the graph in the x-axis, keeping the original graph.
Hence the graph of |y|=(x−1)(x−2) is as shown in the following figure.

Topper's Solved these Questions
- GRAPHICAL TRANSFORMATIONSBOOK - CENGAGECHAPTER - GRAPHICAL TRANSFORMATIONSEXERCISE - Exercise
14 Videos
- GRAPH OF INVERSE TRIGONOMETRIC FUNCTIONSBOOK - CENGAGECHAPTER - GRAPH OF INVERSE TRIGONOMETRIC FUNCTIONSEXERCISE - Exercise
18 Videos
- GRAPHS OF POLYNOMIAL AND RATIONAL FUNCTIONSBOOK - CENGAGECHAPTER - GRAPHS OF POLYNOMIAL AND RATIONAL FUNCTIONSEXERCISE - Exercises
4 Videos
Similar Questions
Draw the graph of y=tan−1x−cot−1x.
View SolutionDraw the graph of y=tan−1x+cot−1x
View SolutionSketch the graph of an example of a rational function f that satisfies all the given conditions.
(i) f(0)=0,f(1),limx→∞f(x)=0,f is odd
(ii) limx→0+f(x)=∞,limx→0−f(x)=−∞,limx→∞f(x)=1,limx→−∞f(x)=1
(iii) limx→−2f(x)=∞,limx→−∞f(x)=3,limx→∞f(x)=3,f(0)=0
View SolutionSketch the curves and identify the region bounded by the curves x=12,x=2,y=logxany=2x. Find the area of this region.
View SolutionSketch the curve |y|=(x−1)(x−2).
View SolutionSketch for the curve y=sin^(-1)((2x)/(1+x^(2)))
View SolutionSketch the curve y=(x−1)(x−2)(x−3).
View SolutionSketch the curve y=sin2x.
View SolutionUse the guidelines to sketch the curve y=2x2x2−1.
View SolutionSketch the curve y=x2−3x(x−1)
View SolutionSketch the curve y = x2−3x(x−1)
View SolutionSketch the curve |y|=(x−1)(x−2).
View SolutionSketch the curve |y|=(x−1)(x−2).
View SolutionSketch the curve |y|=(x−1)(x−2).
View SolutionSketch for the curve y=sin−1(2x1+x2)
View SolutionSketch the curve y=(x−1)(x−2)(x−3).
View Solution
