Study the following graph carefully to answer the questions given below. Expenditure in lakhs) of three different Companies in Five Different Years
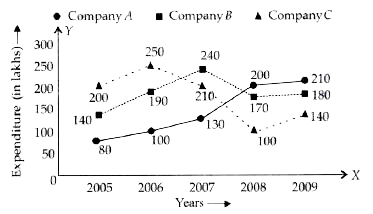
What was the ratio of the expenditure of Company A in the year 2009 to the expenditure of Company B in the year 2005?
Step by step video & image solution for Study the following graph carefully to answer the questions given below. Expenditure in lakhs) of three different Companies in Five Different Years What was the ratio of the expenditure of Company A in the year 2009 to the expenditure of Company B in the year 2005? by Maths experts to help you in doubts & scoring excellent marks in Class 8 exams.
Updated on:21/07/2023Topper's Solved these Questions
- INTRODUCTION TO GRAPHS Book:MTG IIT JEE FOUNDATIONChapter:INTRODUCTION TO GRAPHS Exercise:EXERCISE (INTEGER/NUMERICAL VALUE TYPE)
Explore 5 Videos
- INTRODUCTION TO GRAPHS Book:MTG IIT JEE FOUNDATIONChapter:INTRODUCTION TO GRAPHS Exercise:OLYMPIAD/HOTS CORNER
Explore 5 Videos
- INTRODUCTION TO GRAPHS Book:MTG IIT JEE FOUNDATIONChapter:INTRODUCTION TO GRAPHS Exercise:EXERCISE (SUBJECTIVE PROBLEMS) (SHORT ANSWER TYPE)
Explore 2 Videos
- FOOTSTEPS TOWARDS JEE MAINBook:MTG IIT JEE FOUNDATIONChapter:FOOTSTEPS TOWARDS JEE MAINExercise:Section B (Numerical Value Type Questions)
Explore 9 Videos
- LINEAR EQUATIONS IN ONE VARIABLEBook:MTG IIT JEE FOUNDATIONChapter:LINEAR EQUATIONS IN ONE VARIABLEExercise:Olympiad/HOTS Corner
Explore 15 Videos
Similar Questions
Study the following graph carefully to answer the questions given below. Expenditure in lakhs) of three different Companies in Five Different Years
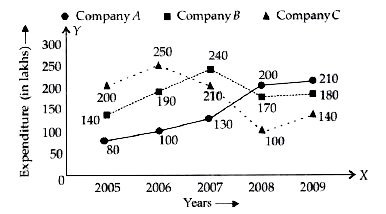
What was the average expenditure of Company C over all the years together?
View SolutionStudy the following graph carefully to answer the questions given below. Expenditure in lakhs) of three different Companies in Five Different Years
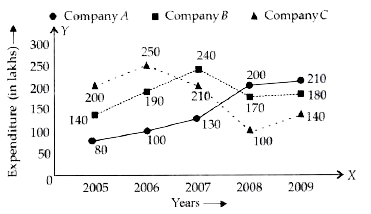
What was the difference between the total expenditure of Company B in the year 2006 and 2008 together and the total expenditure of Company C in the year 2007 and 2009 together?
View Solution
Knowledge Check
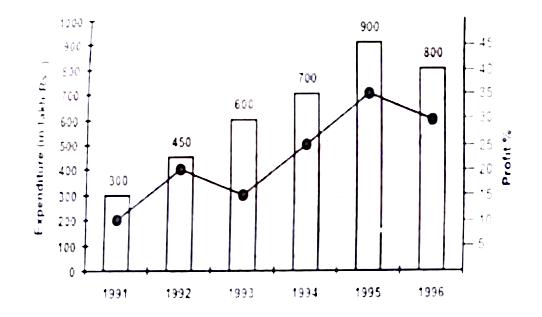
Study the following graph carefully and answer these questions :-
Expenditure and profit percent of a company in different years
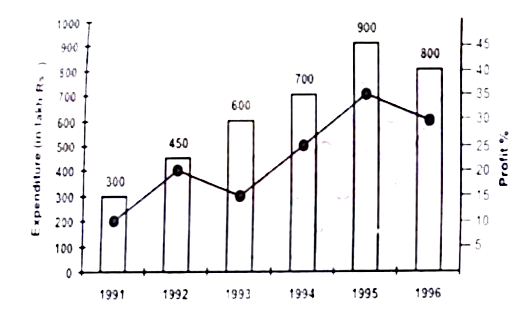
What is the ratio of total income to total expenditure of all the years taken together ?A289:119B375:289C469:375D563:469Study the following graph carefully and answer these questions :-
Expenditure and profit percent of a company in different years
What is the total amount of profit earned in given years ?ARs. 960 lakhsBRs. 920 lakhsCRs. 880 lakhsDRs. 940 lakhsStudy the following graph carefully and answer these questions :-
Expenditure and profit percent of a company in different years
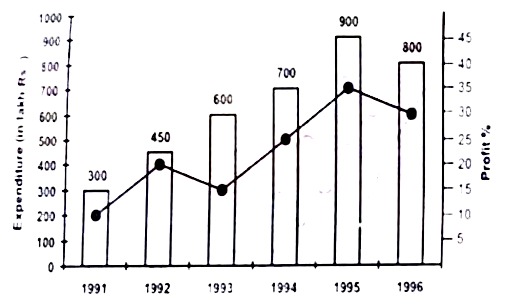
What is the average percentage profit for given years ?A24.5%B18.5%C22.5%D16.5%
Study the following graph carefully to answer the questions given below. Expenditure in lakhs) of three different Companies in Five Different Years
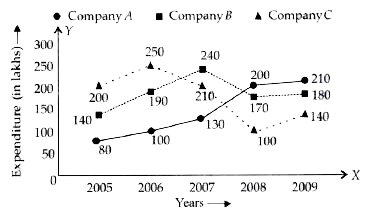
In which year was the total expenditure by all the three companies together second highest?
View SolutionStudy the following graph carefully to answer the questions given below. Expenditure in lakhs) of three different Companies in Five Different Years
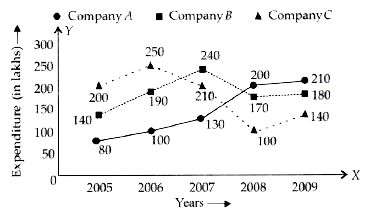
Total expenditure of all the three companies together in the year 2006 was what Percentage of the total expenditure of Company A over all the years together?
View SolutionRead the following graph carfully and answer the questions given below. Production of bulbs by different companies in three years (In lakhs)
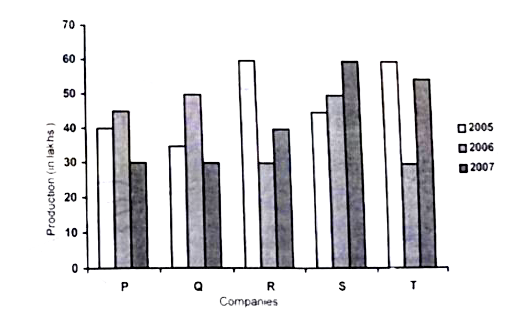
What was the total production of all companies together in the year 2005 ?
View SolutionRead the following graph carfully and answer the questions given below. Production of bulbs by different companies in three years (In lakhs)
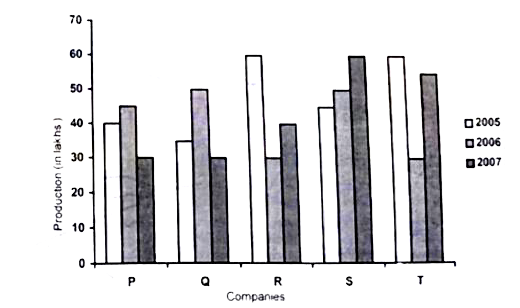
What is the ratio of average production of company Q to the average production of company T in all the given years?
View SolutionStudy the following graph carefully to answer the question that follow
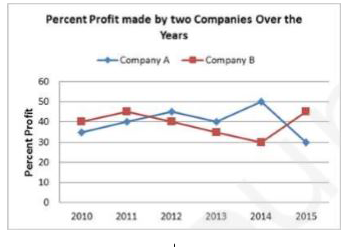
In the year 2014 the income of both the companies A and B was the same what was the respective ratio of expenditure of company A to the expenditure of company B in that year?
View Solution