Study the following table and answer the questions that follow.
Results of half-yearly and annual examinations of class X in a school
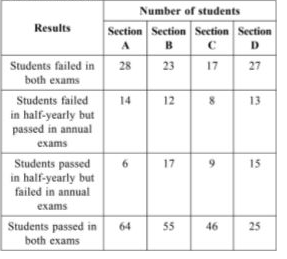
What is the total number of students who failed in either of the two exams but not both?
94
90
47
None of these
The correct Answer is:a
Step by step video, text & image solution for Study the following table and answer the questions that follow. Results of half-yearly and annual examinations of class X in a school What is the total number of students who failed in either of the two exams but not both? by Maths experts to help you in doubts & scoring excellent marks in Class 10 exams.
Updated on:21/07/2023Topper's Solved these Questions
- IMO QUESTION PAPER 2016 SET ABOOK - SCIENCE OLYMPIAD FOUNDATION CHAPTER - IMO QUESTION PAPER 2016 SET AEXERCISE - EVERYDAY MATHEMATICS
10 Videos
- IMO QUESTION PAPER 2016 SET ABOOK - SCIENCE OLYMPIAD FOUNDATION CHAPTER - IMO QUESTION PAPER 2016 SET AEXERCISE - ACHIEVERS SECTION
5 Videos
- IMO QUESTION PAPER 2016 SET ABOOK - SCIENCE OLYMPIAD FOUNDATION CHAPTER - IMO QUESTION PAPER 2016 SET AEXERCISE - ACHIEVERS SECTION
5 Videos
- COORDINATE GEOMETRYBOOK - SCIENCE OLYMPIAD FOUNDATION CHAPTER - COORDINATE GEOMETRYEXERCISE - ACHIEVERS SECTION (HOTS)
3 Videos
- IMO QUESTION PAPER 2016 SET BBOOK - SCIENCE OLYMPIAD FOUNDATION CHAPTER - IMO QUESTION PAPER 2016 SET BEXERCISE - ACHIEVERS SECTION
5 Videos
Similar Questions
Study the given pie chart and answer the question that follows
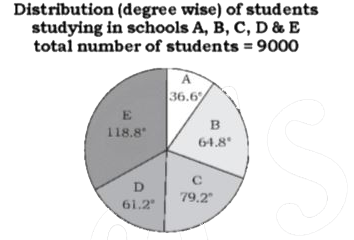
The total number of students in schools D and E is what percentage more than the number of students in schools B and C?
View SolutionStudy the following bar graph and answer the questions given below.
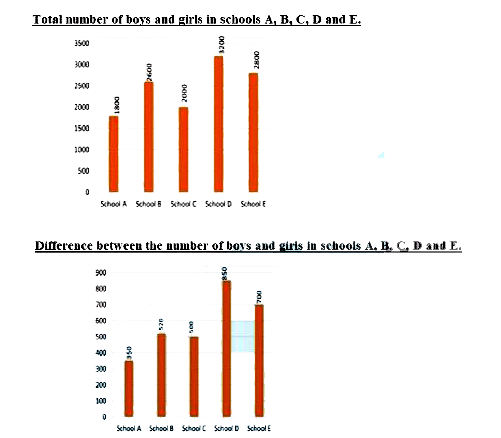
The number of boys in school B is what percentage of the total number of students in that school ?
View Solution
Knowledge Check
Study the following table and answer the questions.

The total number of students scoring 50% or more marks isA1250B875C775D675Study the following graph carefully and answer the questions that follow
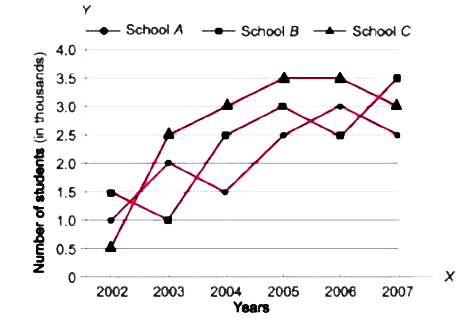
What was the average number of students in all schools together in the year 2006 ?A30000B9000C3000D6000Study the following table and answer question.
Number of students appeared in an examination from five citie s:
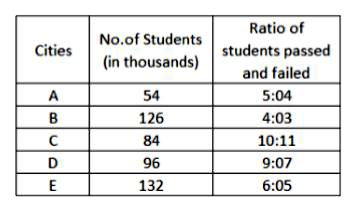
The total number of students who appeared in the examination from cities C and D is what percent more than the total number of students who failed in cities A, B and E ? (nearest to an integer)A44B30C41D42
Study the following table and answer question.
Number of students appeared in an examination from five cities :
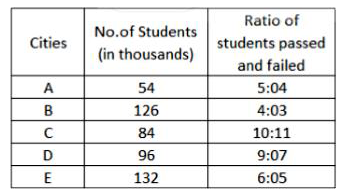
The ratio of the total number of students passed in the examination from cities A and D to that of students failed from cities B and E ?
View SolutionStudy the following table and answer the questions.

Which school has the highest number of students scoring exactly 50% marks ?
View SolutionStudy the following table and answer questions:
Number of candidates appeared in an examination from five cities:
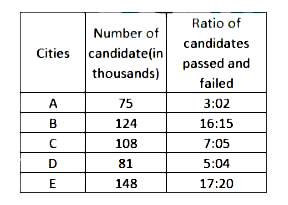
The ratio of the total number of candidates who passed from cities A and C to that who failed in cities B and E is:
View SolutionStudy the following table carefully and answer the questions given below :

What is the percentage of students studying Management with respect to the total number of students studying in the institute B ?
View SolutionStudy the following graph carefully and answer the questions that follow
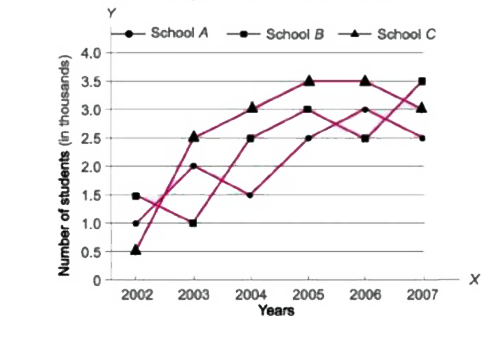
What was the difference between the total number of students in all schools together in the year 2003 and the number of students in school B in the year 2005 ?
View Solution
