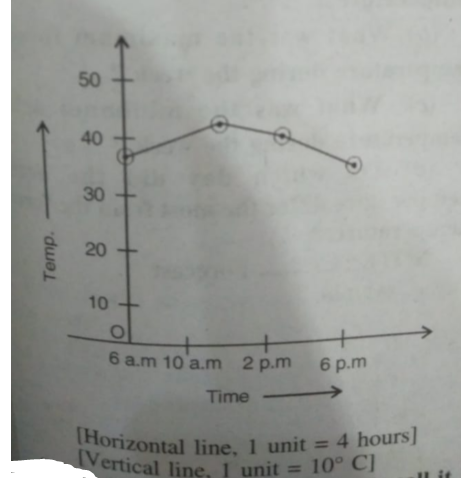
Take this graph drawn by a doctor recording the temperature of Renu at different times and answer the given questions.

What does this graph (we may call it temperature graph)show?Solution in Punjabi
Step by step video & image solution for Take this graph drawn by a doctor recording the temperature of Renu at different times and answer the given questions.What does this graph (we may call it temperature graph)show? by Maths experts to help you in doubts & scoring excellent marks in Class 8 exams.
Updated on:21/07/2023Topper's Solved these Questions
Similar Questions
Plot the points(5,0),(0.5),(2,5),(5,2)and (6,3) in the cartesian plane by using a graph paper.
View SolutionFind the H.C.F. of the following :
2xy,6x2y3,8x3y2.
View SolutionWhen water freezes its volume increases by 4%.What volumeof water is required to make 221cm3 of ice?
View SolutionHow many lines of symmetry does the above figure have ?
View SolutionDetermine the point of symmetry of a regular hexagon.
View SolutionDtermine the images of the following figure about the given line :
View SolutionMatch the following Column A to Column B

View SolutionMatch the following Column A to Column B

View SolutionMatch the following Column A to Column B

View SolutionThe inequation represented by the graph given below is :
View SolutionThe inequation that best describes the graph given below is _________
View SolutionThe inequation that best describes the following graph is _________
View SolutionWhich inequations represent the shaded region in the given figure
View SolutionWhich of the following statement is not correc for following straight line graph :-
ltimg src="https://d10lpgp6xz60nq.cloudfront.net/physics_images/ALN_PHY_R04_E01_015_Q01.png" width="80%"gt
View SolutionMagnitude of slope i.e. steepness of graph shown in figure ltimg src="https://d10lpgp6xz60nq.cloudfront.net/physics_images/ALN_PHY_R04_E01_026_Q01.png" width="80%"gt
View Solution
