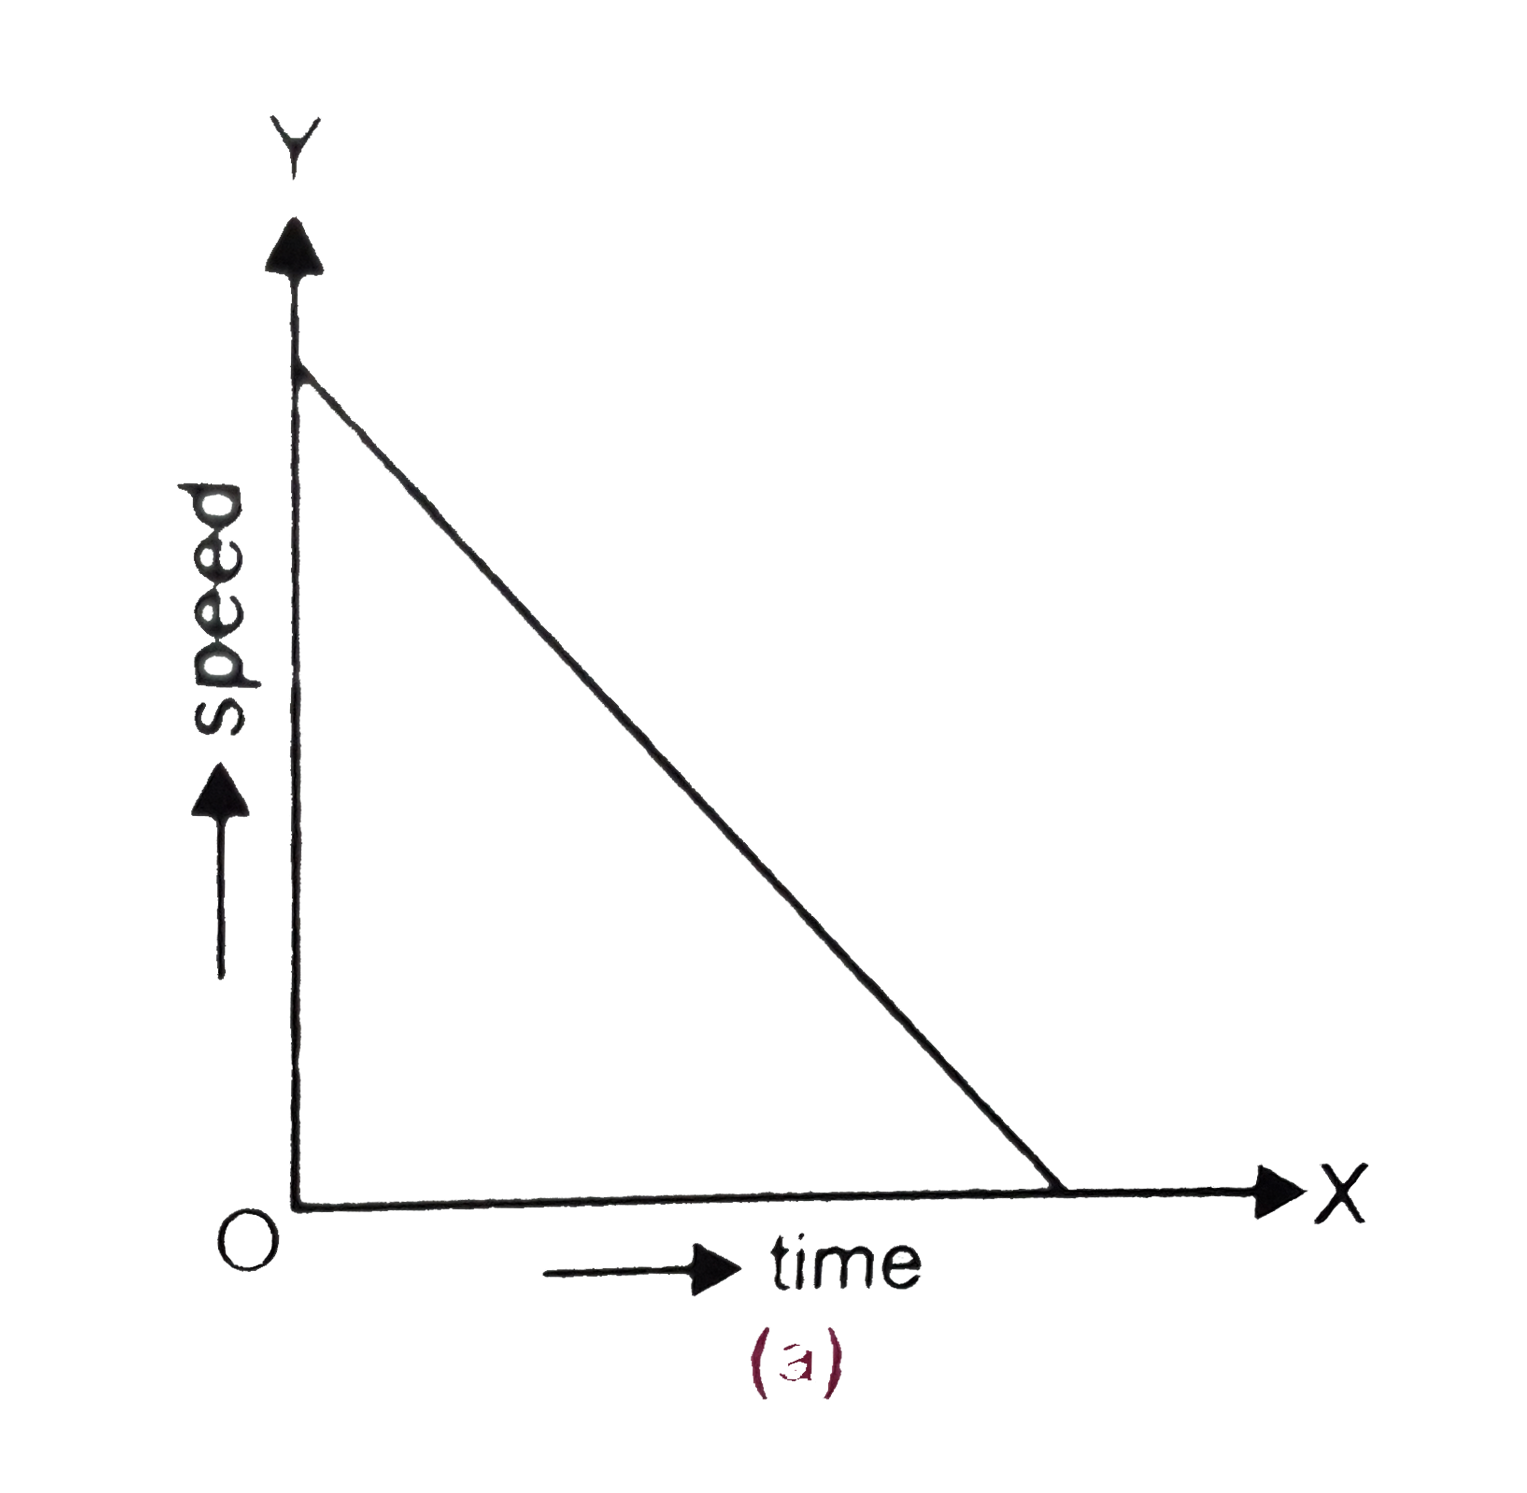
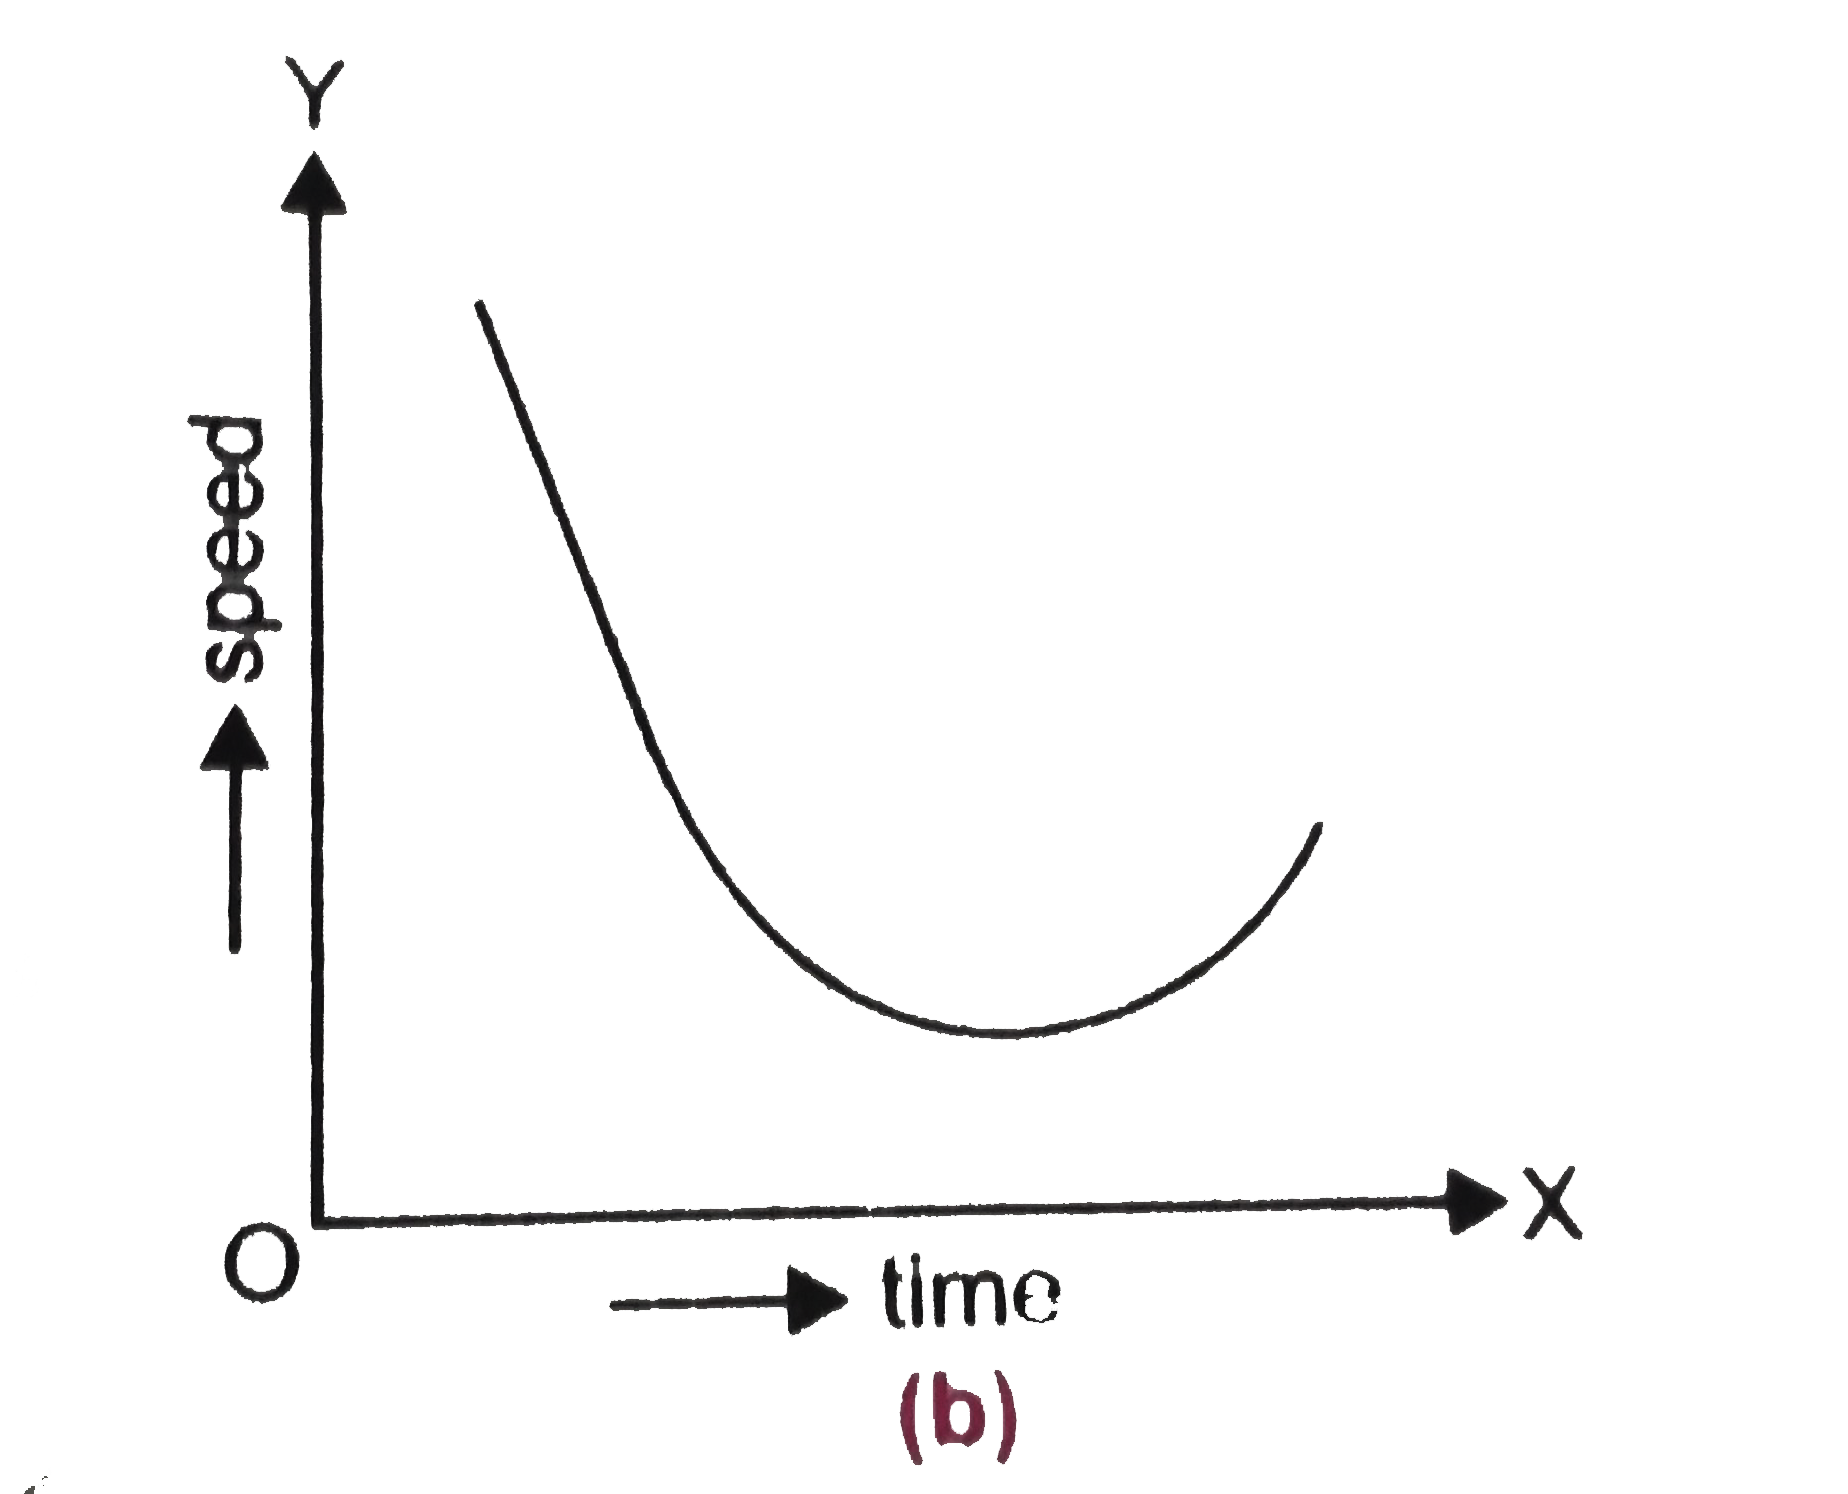
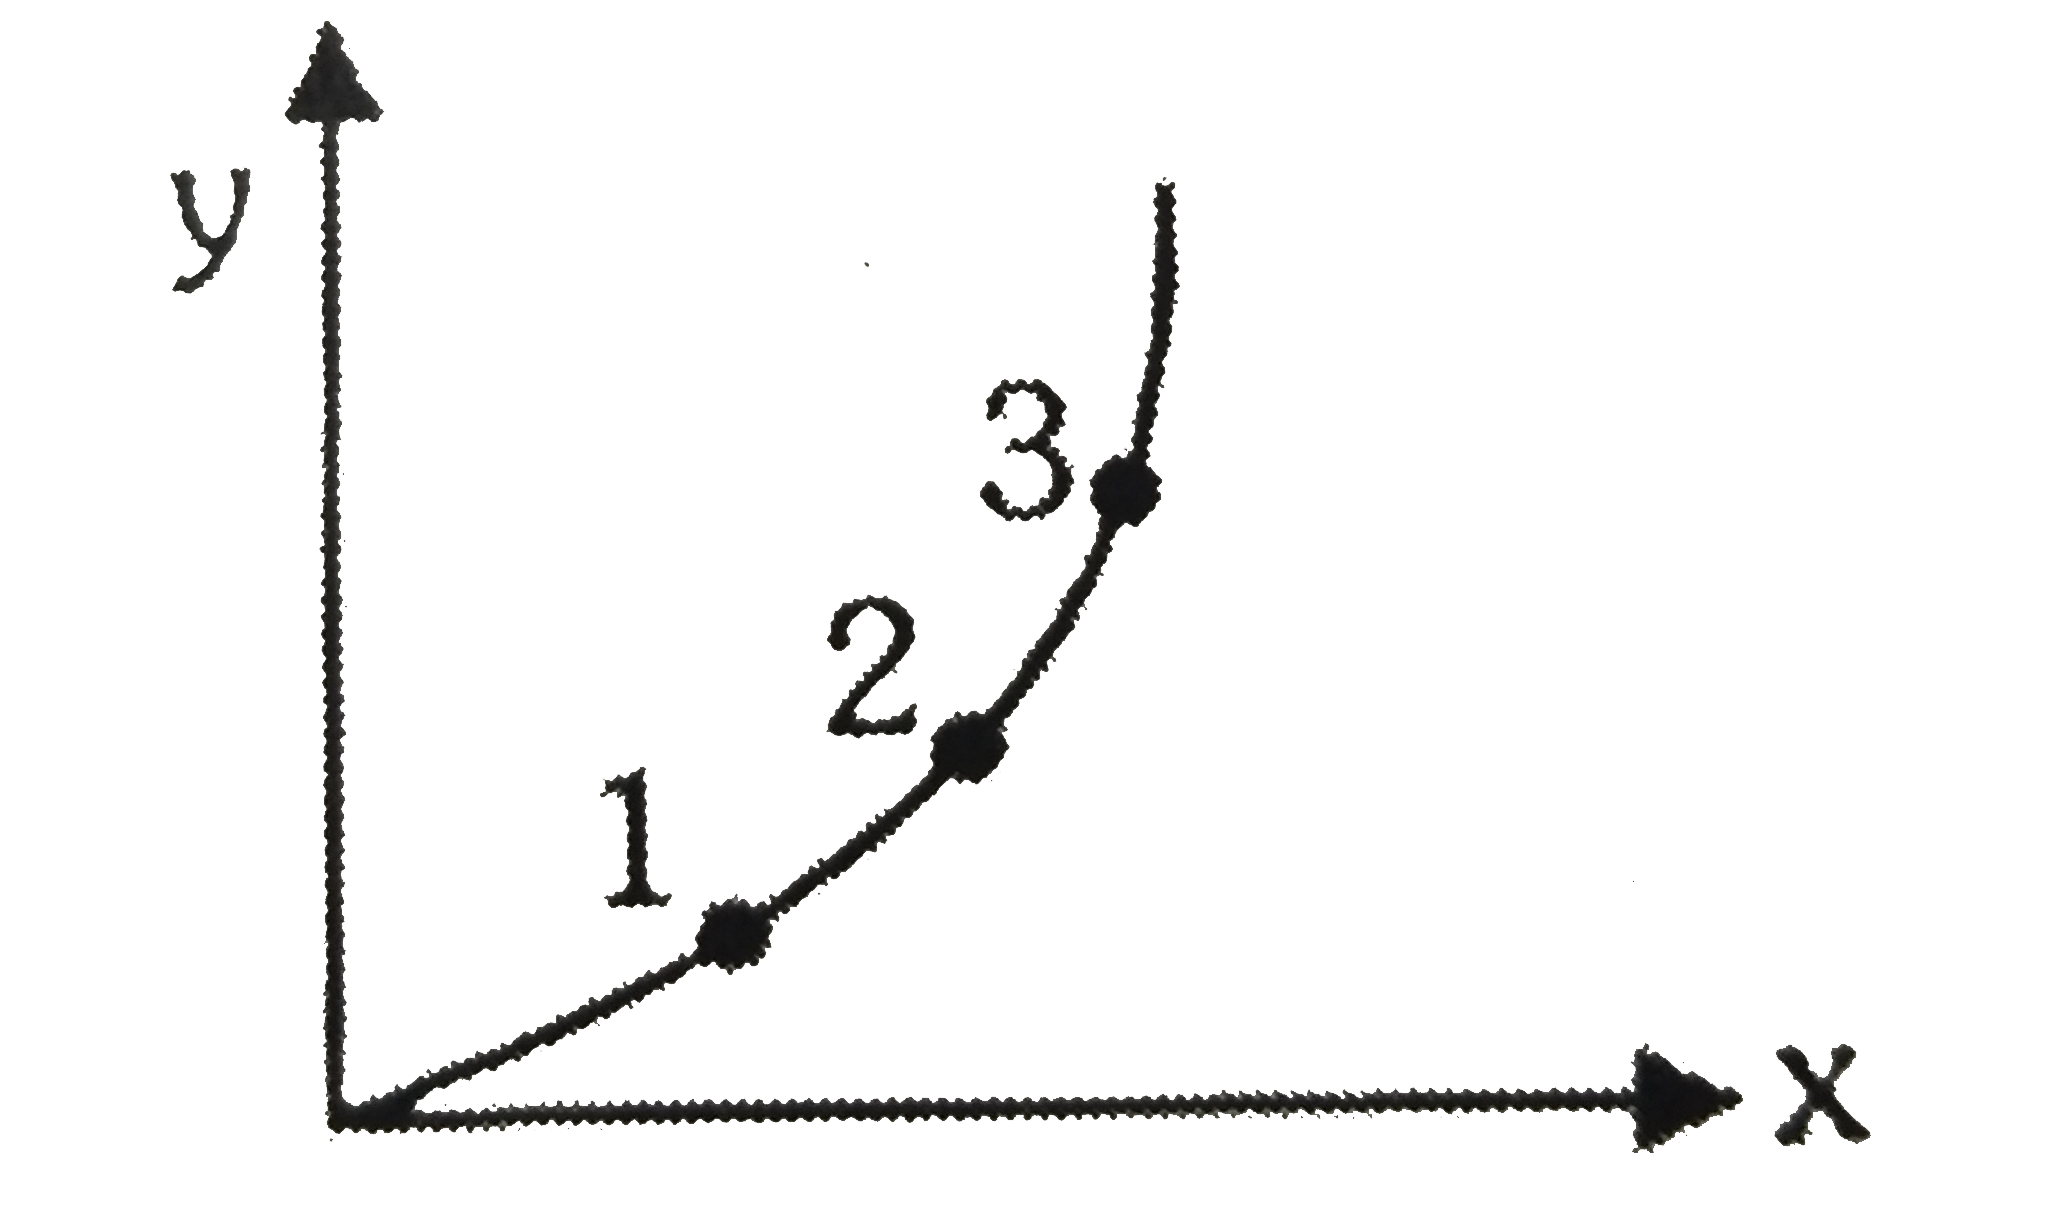
Magnitude of slope i.e. steepness of graph shown in figure

First increases and then decreases
First decreases and then increases
Decreases continuously
Increases continuously
The correct Answer is:B
Step by step video & image solution for Magnitude of slope i.e. steepness of graph shown in figure by Physics experts to help you in doubts & scoring excellent marks in Class 12 exams.
Updated on:21/07/2023Topper's Solved these Questions
- RACEBOOK - ALLENCHAPTER - RACEEXERCISE - Basic Maths (Co-ordinate & Algebra)
39 Videos
- RACEBOOK - ALLENCHAPTER - RACEEXERCISE - Basic Maths (VECTORS)
57 Videos
- RACEBOOK - ALLENCHAPTER - RACEEXERCISE - Basic Maths (Integration)
12 Videos
- NEWTONS LAWS OF MOTIONBOOK - ALLENCHAPTER - NEWTONS LAWS OF MOTIONEXERCISE - EXERCISE-III
28 Videos
- SIMPLE HARMONIC MOTIONBOOK - ALLENCHAPTER - SIMPLE HARMONIC MOTIONEXERCISE - Example
1 Videos
Similar Questions
Knowledge Check
Magnitude of slope of the shown graph.
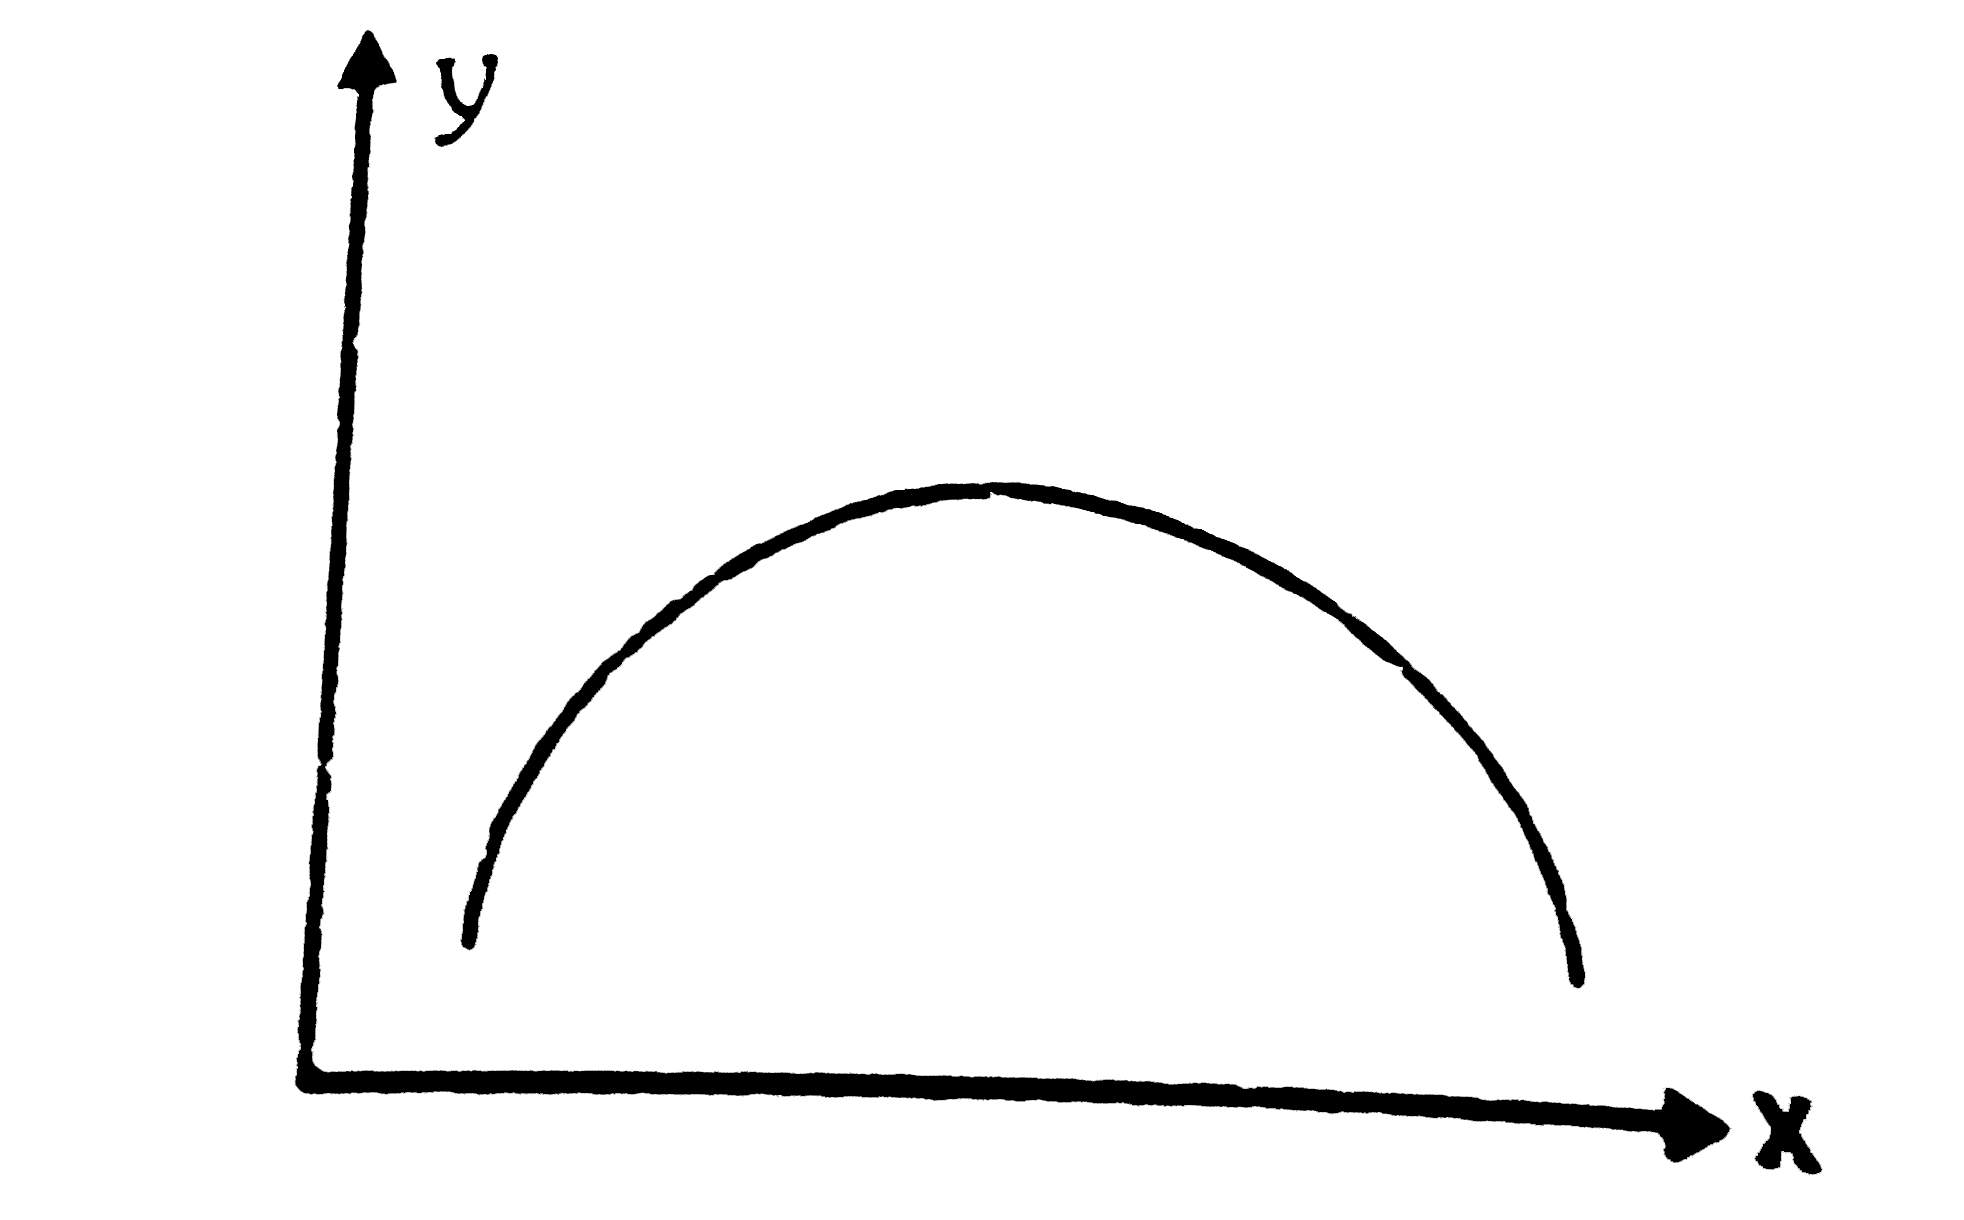 AFirst increases then decresesBFirst decrease then increasesCIncreasesDDecreases
If the system is in equilibrium, the magnitude of friction acting on block B shown in the figure is
 A10NB18NC15NDCan not be determined
Find i in shown figure.
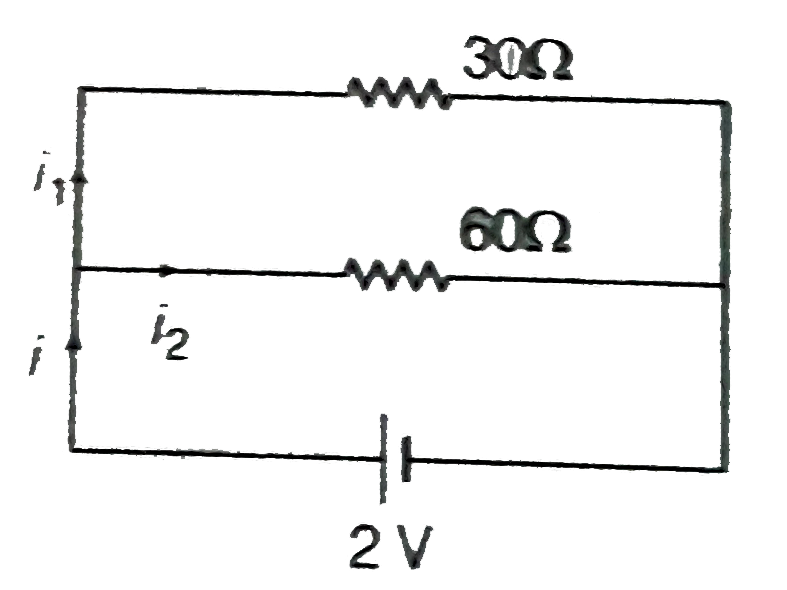 A0.2 AB0.1 AC0.3 AD0.4 A
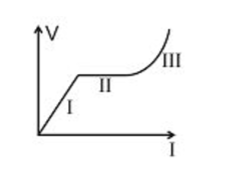
Voltage V v/s I graph is shown in the figure.
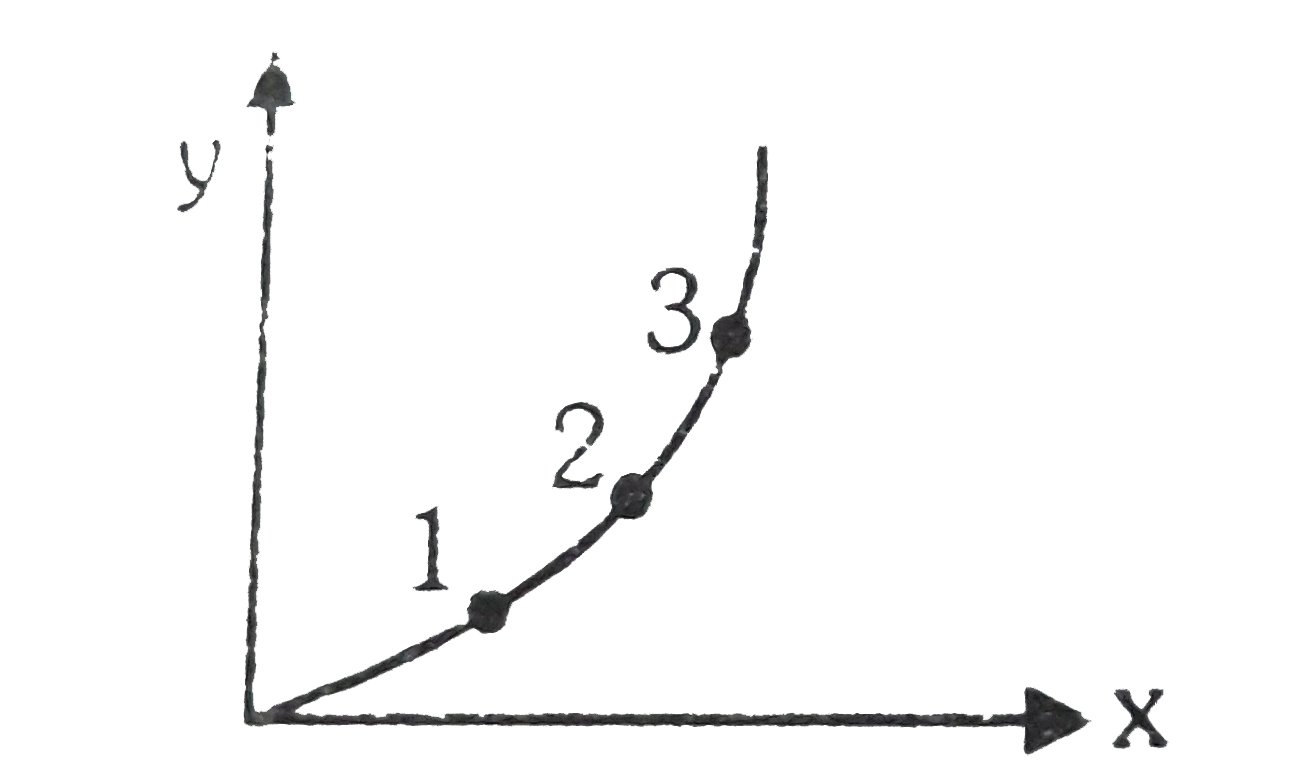
View SolutionThe slope of graph as shown in figure at points 1,2 and 3 is m1,m2 and m3 respectively then
View SolutionThe current i in an induction coil varies with time according to the graph shown in figure. Which of the following graph shows induced emf in the coil with time:
View SolutionThe slope of graph as shown in figure at points 1, 2 and 3 is m1,m2andm3 respectively then
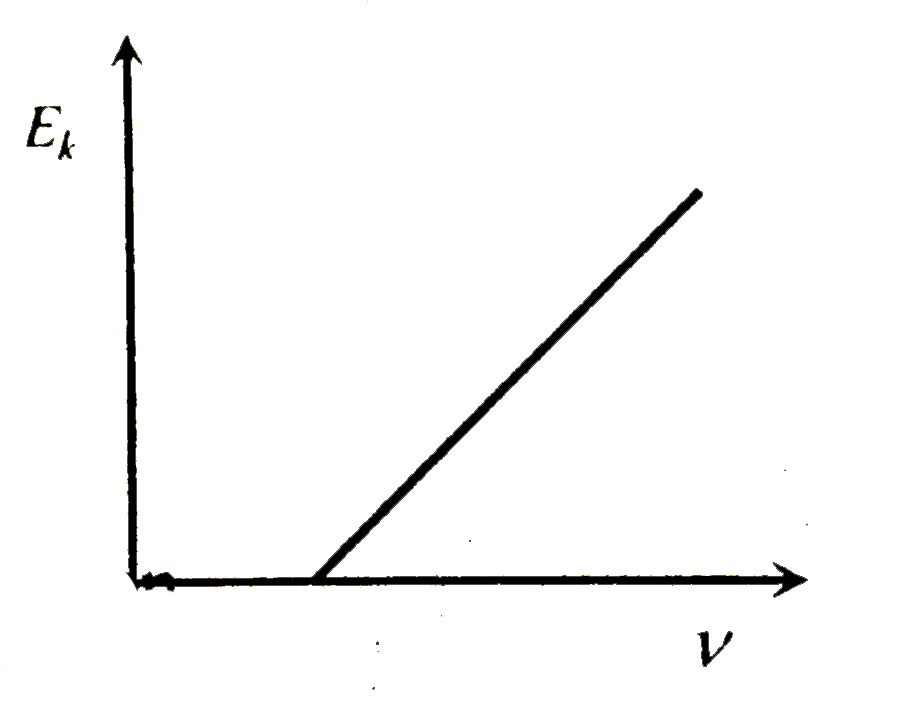
View SolutionFor the photoelectric effect, the maximum kinetic energy Ek of the emitted photoelectrons is plotted against the frequency ν of the incident photons as shown in the figure. The slope of the curve gives
View Solution

