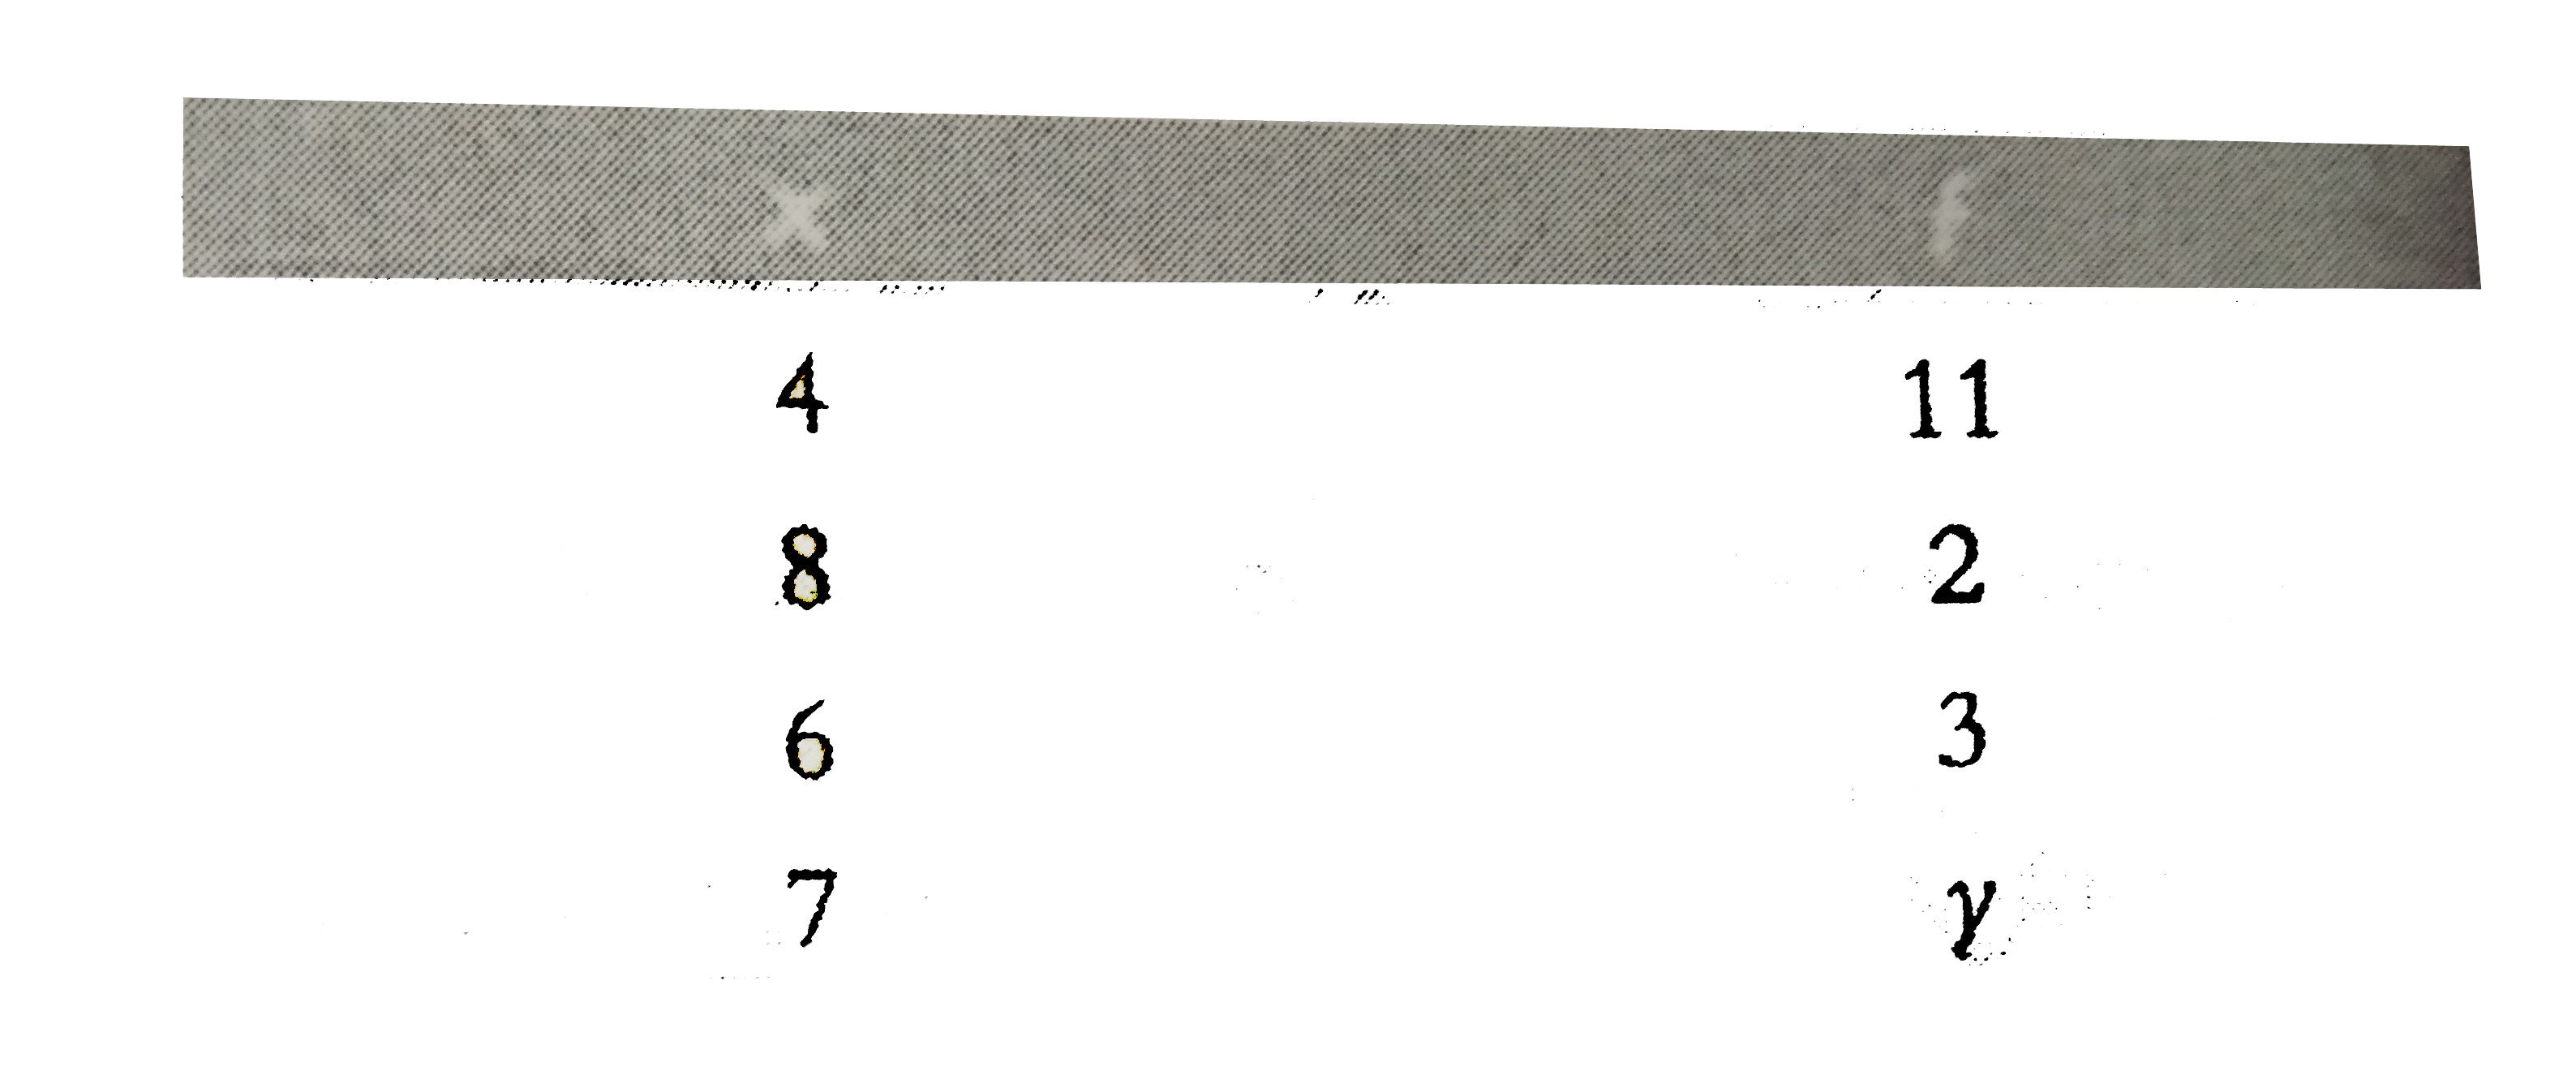
The agewise participation of students in the Annual Function of a school is shown in the following distribution

Find the missing frequncies when the sum of frequnceis is 181 . Also , find the mode of the data.
Step by step video & image solution for The agewise participation of students in the Annual Function of a school is shown in the following distribution Find the missing frequncies when the sum of frequnceis is 181 . Also , find the mode of the data. by Maths experts to help you in doubts & scoring excellent marks in Class 10 exams.
Updated on:21/07/2023Topper's Solved these Questions
- MEAN,MEDAN,MODE OF GROUPED,DATA CUMULATIVE FREQUENCY GRAPH AND OGIVE BOOK - RS AGGARWALCHAPTER - MEAN,MEDAN,MODE OF GROUPED,DATA CUMULATIVE FREQUENCY GRAPH AND OGIVE EXERCISE - EXERCISE 18 D
3 Videos
- MEAN,MEDAN,MODE OF GROUPED,DATA CUMULATIVE FREQUENCY GRAPH AND OGIVE BOOK - RS AGGARWALCHAPTER - MEAN,MEDAN,MODE OF GROUPED,DATA CUMULATIVE FREQUENCY GRAPH AND OGIVE EXERCISE - EXERCISE 18 E
10 Videos
- MEAN,MEDAN,MODE OF GROUPED,DATA CUMULATIVE FREQUENCY GRAPH AND OGIVE BOOK - RS AGGARWALCHAPTER - MEAN,MEDAN,MODE OF GROUPED,DATA CUMULATIVE FREQUENCY GRAPH AND OGIVE EXERCISE - EXERCISE 18 B
14 Videos
- LINEAR EQUATIONS IN TWO VARIABLES BOOK - RS AGGARWALCHAPTER - LINEAR EQUATIONS IN TWO VARIABLES EXERCISE - QUESTION
2 Videos
- PERIMETER AND AREA OF PLANE FIGURES BOOK - RS AGGARWALCHAPTER - PERIMETER AND AREA OF PLANE FIGURES EXERCISE - TEST YOURSELF (SHORT -ANSWER QUESTIONS)
1 Videos
Similar Questions
Knowledge Check
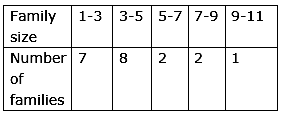
A survey conducted on 20 households in a locality by a group of students resulted in the following frequency table for the number of family members in a household:Find the mode of this data.
 A4B3.8C3.286DNone
Find the mean median of the following frequency distrbution :

Also, find the mode of the following data.
View SolutionThe mode of the following frequency distribution is 46 and the total frequency is 150. Find the missing frequencies x and y.
View SolutionIf the mean of the following data is 5.3 , then find the missing frequency y of the following distribution :

View SolutionThe following table shows frequency distribution of the number of saplings planted by the students of a school :

Find the modal number of saplings planted.
View SolutionThe mean of the following frequency distribution is 57.6 and the sum of the observations is 50. Find the missing frquencies f1andf2 :

View SolutionAt an annual function of a school each student gives gift to every other student. If the number of gifts is 1980, find the number of students.
View SolutionA survey regarding the heights (in cm) of 50 girls of class X of a school was conducted and the following data was obtained.

Find the mean, median and mode.
View Solution


