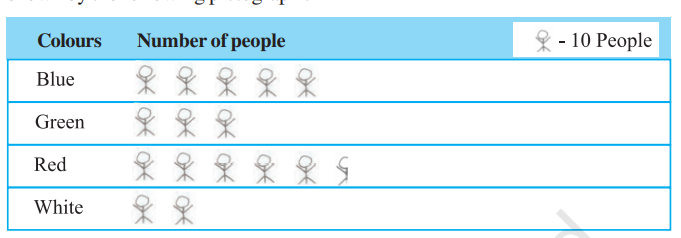
The colours of fridges preferred by people living in a locality are shown by the following pictograph

a) Find the number of people preferring blue colour
b)How many people like red colour
(a) Blue colour is preferred by 50 people.
( = 10, so 5 pictures indicate 5×10 people).
(b) Deciding the number of people liking red colour needs more care.
For 5 complete pictures, we get5×10=50 people
For the last incomplete
picture, we may roughly take it as 5.
So, number of people preferring red colour is nearly 55.
Topper's Solved these Questions
- DATA HANDLINGBOOK - NCERTCHAPTER - DATA HANDLINGEXERCISE - EXERCISE 9.3
3 Videos
- DATA HANDLINGBOOK - NCERTCHAPTER - DATA HANDLINGEXERCISE - EXERCISE 9.4
4 Videos
- DATA HANDLINGBOOK - NCERTCHAPTER - DATA HANDLINGEXERCISE - EXERCISE 9.1
7 Videos
- BASIC GEOMETRICAL IDEASBOOK - NCERTCHAPTER - BASIC GEOMETRICAL IDEASEXERCISE - EXERCISE 4.6
4 Videos
- DECIMALSBOOK - NCERTCHAPTER - DECIMALSEXERCISE - EXERCISE 8.1
10 Videos
Similar Questions
Observe this bar graph which shows the marks obtained by Aziz in half-yearly examination in different subjects.
View SolutionNumber of persons in various age groups in a town is given in the following tableDraw a bar graph to represent the above information and answer the following questions. (take 1 unit length = 20 thousands)(a) Which two age groups have same population?(b) All persons in the age group of 60 and above are called senior citizens. How many senior citizens are there in the town?
View SolutionThe number of girl students in each class of a co-educational middle school is depicted by the pictograph Observe this pictograph and answer the following questions :(a) Which class has the minimum number of girl students?(b) Is the number of girls in Class VI less than the number of girls in Class V?(c) How many girls are there in Class VII?
View SolutionDraw any circle and mark(a) its centre (b) a radius(c) a diameter (d) a sector(e) a segment (f) a point in its interior(g) a point in its exterior (h) an arc
View SolutionShow the following numbers on the number line.
(a) 0.2
(b) 1.9
(c) 1.1
(d) 2.5
View SolutionHow many lines of symmetry does the above figure have ?
View SolutionDetermine the point of symmetry of a regular hexagon.
View SolutionDtermine the images of the following figure about the given line :
View SolutionMatch the following Column A to Column B

View SolutionMatch the following Column A to Column B

View SolutionMatch the following Column A to Column B

View SolutionThe inequation represented by the graph given below is :
View SolutionThe inequation that best describes the graph given below is _________
View SolutionThe inequation that best describes the following graph is _________
View SolutionFor shown situation find ∠BCA :-
ltimg src="https://d10lpgp6xz60nq.cloudfront.net/physics_images/ALN_PHY_R05_E01_035_Q01.png" width="80%"gt
View Solution
