The following are the number of electric bulbs purchased for alodging house during the first four months of a year
Let ⋈ be the 10 bulbs
January ⋈⋈
February ⋈⋈⋉
March ⋈⋈⋈
April ⋈⋈⋈⋉
Topper's Solved these Questions
- BOOK - NCERTCHAPTER - DATA HANDLINGEXERCISE - EXERCISE 9.33videos
DATA HANDLING
- BOOK - NCERTCHAPTER - DATA HANDLINGEXERCISE - EXERCISE 9.44videos
DATA HANDLING
- BOOK - NCERTCHAPTER - DATA HANDLINGEXERCISE - EXERCISE 9.17videos
DATA HANDLING
- BOOK - NCERTCHAPTER - BASIC GEOMETRICAL IDEASEXERCISE - EXERCISE 4.64videos
BASIC GEOMETRICAL IDEAS
- BOOK - NCERTCHAPTER - DECIMALSEXERCISE - EXERCISE 8.110videos
DECIMALS
Similar Questions
The following are the number of electric bulbs purchased for alodging house during the first four months of a year
View SolutionThe bar-chart is showing the number of accidents in a city during the first six month of a year. Examine the bar chart and answer the following questions.
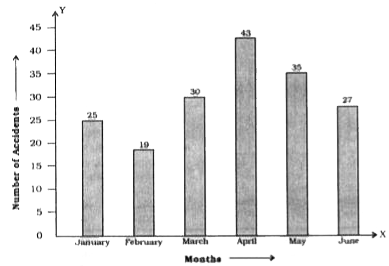
Compared to the month of January, what is the percentage of decrease in accidents in the month of February?View Solution
Knowledge Check
- Question 1 - Select One
The first month of Saka year is
AvaisakhBchaitraCjyeshthaDpaush - Question 2 - Select One
The Bar graph given below presents the number of books sold by a bookseller during different months of a year.
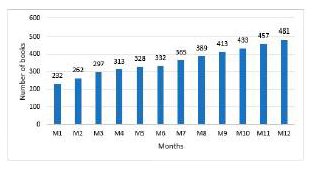
What is the total number of books sold by the bookseller in the year?A4032B4132C4302D4202 - Question 3 - Select One
The Bar graph given below presents the number of books sold by a bookseller during different months of a year.
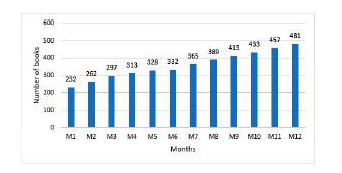
The number of books sold in month M8 is how much more than the average number of books sold per month?A34.5B22.5C30.5D26.5
What shopping products have been purchased by you/ your family in the last six months. Make a list and specify what factors infulence the purchase of each of these products.
View SolutionThe bar-chart is showing the number of accidents in a city during the first six month of a year. Examine the bar chart and answer the following questions.
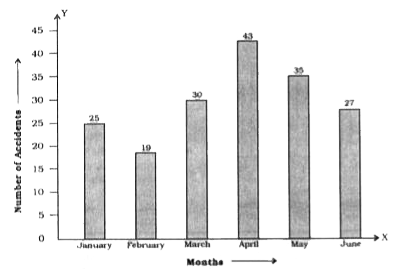
What is the percentage of accidents in the month of April to the total accidents in the city ?View SolutionThe bar-chart is showing the number of accidents in a city during the first six month of a year. Examine the bar chart and answer the following questions.
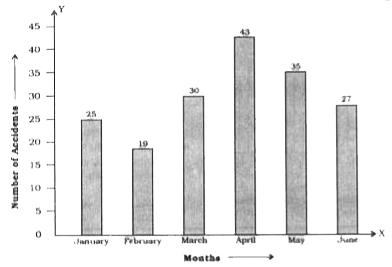
By what number, is the number of accidents that occurred in April is greater than the average number of accidents that occured during the 6 months period ?View SolutionThe bar-chart is showing the number of accidents in a city during the first six month of a year. Examine the bar chart and answer the following questions.
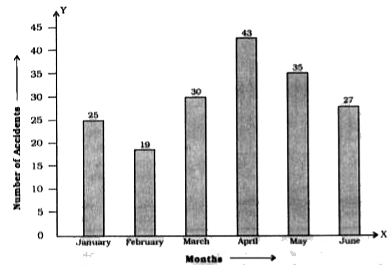
Percentage of decrease in t he number of accidents from May to June is :View SolutionList five shopping products purchased by you and your family during the last few months.
View Solution

