The data on the number of patients attending a hospital in a month are given below. Find the average (mean) number of patients attending the hospital in a month by using the shortcut method.

The correct Answer is:40.33
Step by step video & image solution for The data on the number of patients attending a hospital in a month are given below. Find the average (mean) number of patients attending the hospital in a month by using the shortcut method. by Maths experts to help you in doubts & scoring excellent marks in Class 10 exams.
Updated on:21/07/2023Topper's Solved these Questions
Similar Questions
The data on the number of patient attending a hospital in a month are given below. Find the average (mean) number of patients attending the hospital in a month by using the shortcut method.
Take the assumed mean as 45. Give your answer correct to 2 decimal places.

View SolutionCalculate the mean of the distribution given below using the short cut method.

View Solution
Knowledge Check

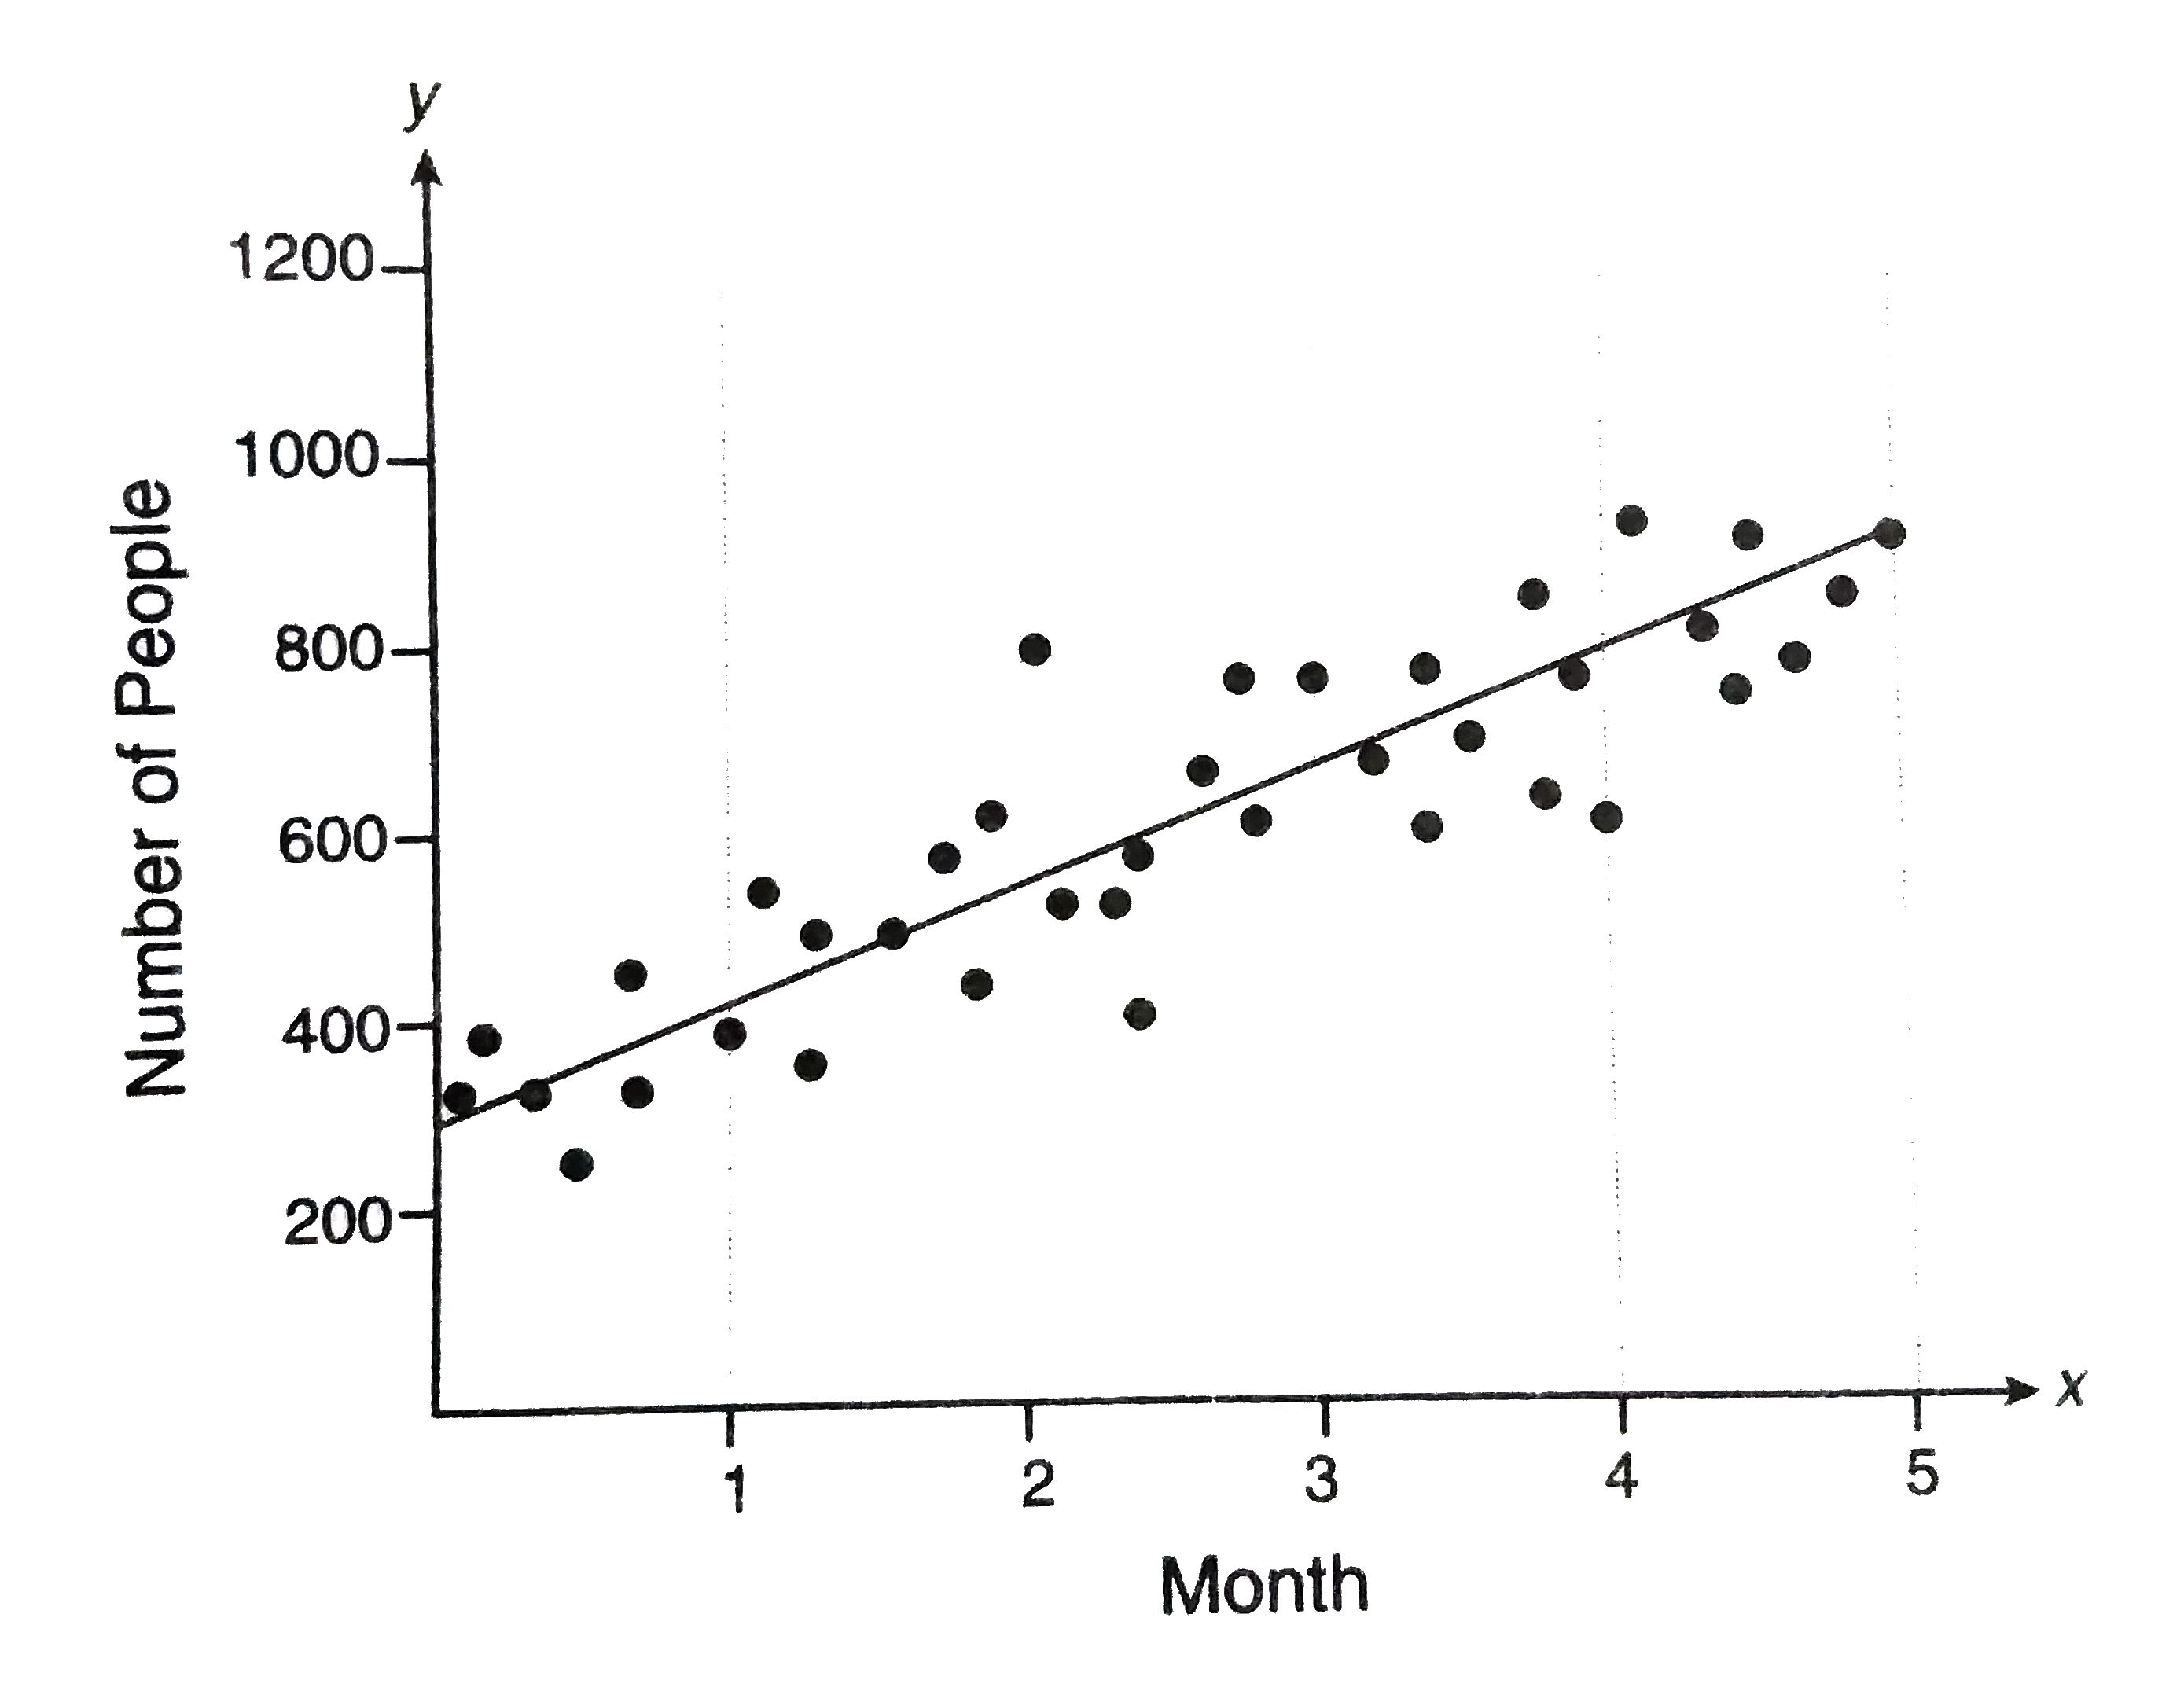
A new fitness class was started at several fitness clubs owned by the same company. The scatterplot shows the total number of people attending the class during the first five months in which the class was offered. The line of best fit is drawn.
Q. During the five-month period, the average increase in the number of people attending the class per month is closest to which of the following?A80B100C120D140
Calculate the mean of the distribution, given below, using the short cut method:
View SolutionState, which of the following variables are continuous and which are discrete :
number of patients in a hospital.
View SolutionFind the index number by using simple aggregate method.

View SolutionThe distribution below shows the number of wickets taken by bowlers in one-day cricket matches. Find the mean number of wickets by choosing a suitable method. What does the mean signify?
View SolutionThe following table shows the ages of the patients admitted in a hospital during a year:Find the mode and the mean of the data given above. Compare and interpret the two measures of central tendency.
View SolutionFind the mean deviation from the mean of the following data, using the step deviation method.

View SolutionThe temperature of patient, admitted in a hospital with typhoid fever, taken at different times of the day are given below. Draw the temperature-time graph to represent the data: Time (in hours), 6:00, 8:00, 10:00, 12:00, 14:00, 16:00, 18:00 Temp. (in 0F): , 102, 100, 99, 103, 100, 102, 99
View Solution
