The demand of different shirt sizes, as obtained by a survey, is given below :

Find the mean as observed from the survey .
The correct Answer is:39.928
Step by step video, text & image solution for The demand of different shirt sizes, as obtained by a survey, is given below : Find the mean as observed from the survey . by Maths experts to help you in doubts & scoring excellent marks in Class 9 exams.
Updated on:21/07/2023Topper's Solved these Questions
- STATISTICSBOOK - MTG IIT JEE FOUNDATIONCHAPTER - STATISTICSEXERCISE - NCERT SECTION (Exercise 14.1)
2 Videos
- STATISTICSBOOK - MTG IIT JEE FOUNDATIONCHAPTER - STATISTICSEXERCISE - NCERT SECTION (Exercise 14.2)
15 Videos
- STATISTICSBOOK - MTG IIT JEE FOUNDATIONCHAPTER - STATISTICSEXERCISE - Olympiad/HOTS Corner
20 Videos
- QUADRILATERALS BOOK - MTG IIT JEE FOUNDATIONCHAPTER - QUADRILATERALS EXERCISE - Olympiad/HOTS CORNER
15 Videos
- TRIANGLESBOOK - MTG IIT JEE FOUNDATIONCHAPTER - TRIANGLESEXERCISE - OLYMPAID/ HOTS CORNER
10 Videos
Similar Questions
The demand of different shirt sizes, as obtained by a survey, is given below: Size:, 38, 39, 40, 41, 42, 43, 44, total No. of Person (wearing it):, 26, 39, 20, 15, 13, 7, 5, 125 Find the modal shirt sizes, as observed from the survey.
View SolutionThe marks obtained by 110 students in an examination are given below:
Find the mean marks of the studens.

View Solution
Knowledge Check
The marks (maximum marks 100) obtained by 20 students in a test are given below :
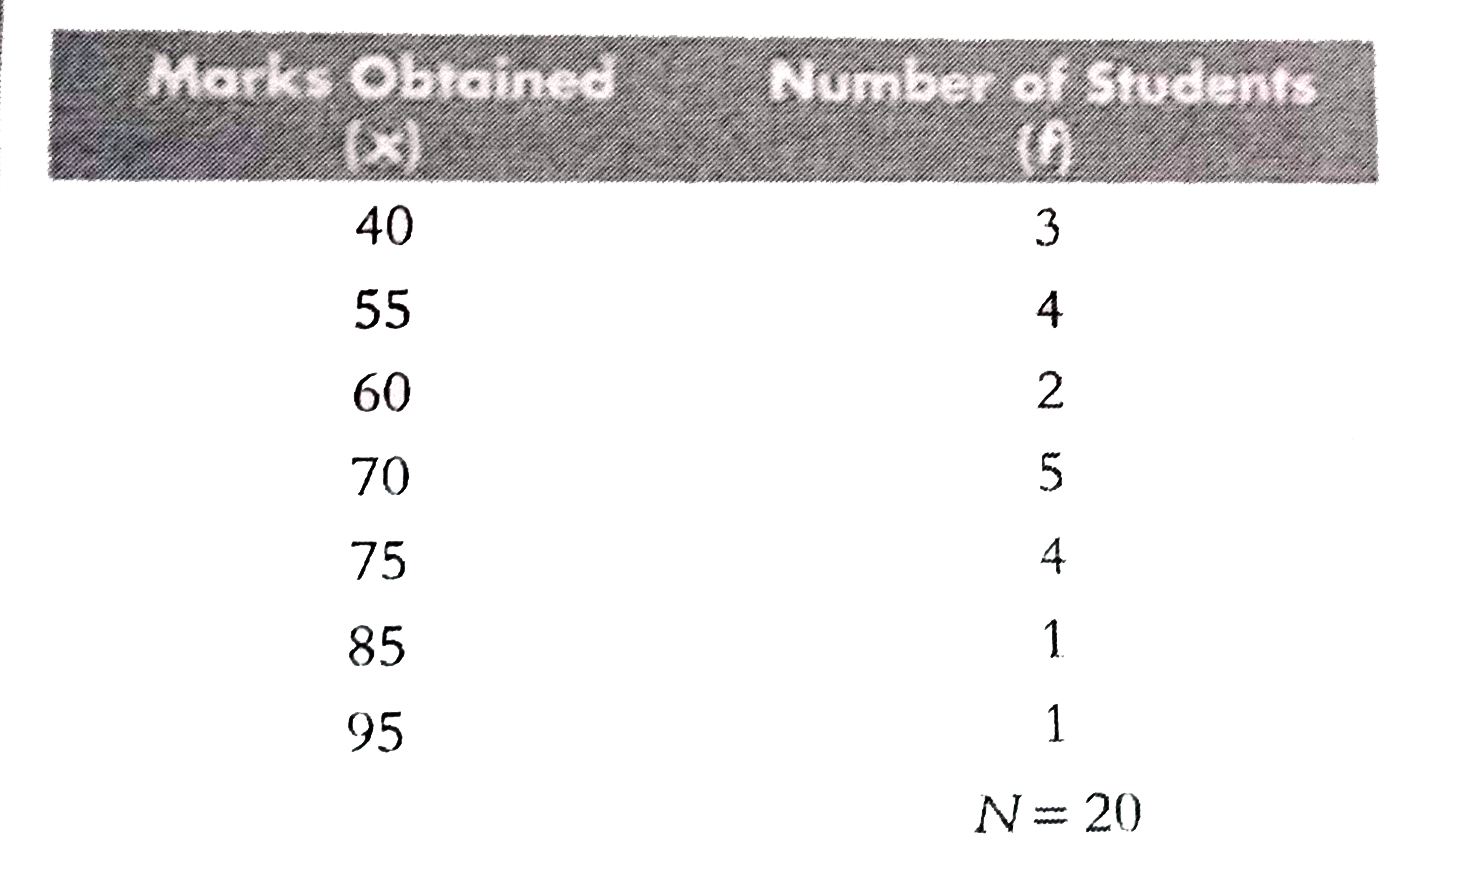
Find the mean marks of the 20 students.A64B64.5C54D54.5What can a historian not derive from surveys?
AWe can collect the right data, figures and Information regarding a subjectBWe can find out past behaviour and structure of socletyCWe can find out the culture, habits and means of livellhood of the peopleDAll of the aboveThe histogram, given below, shows the number of families of a locality having various daily incomes, as obtained by a survey. Observe the graph and answer the questions based on it.
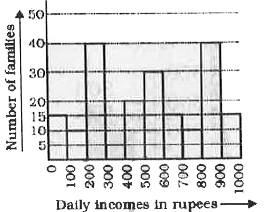
The number of families, whose daily incomes are below Rs 200, isA25B20C15D10
Observe the figures given below :
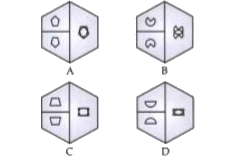
The odd one out from the given figure is ____
View SolutionThe frequency distribution of the marks obtained by 28 students in a test carrying 40 marks is given below :
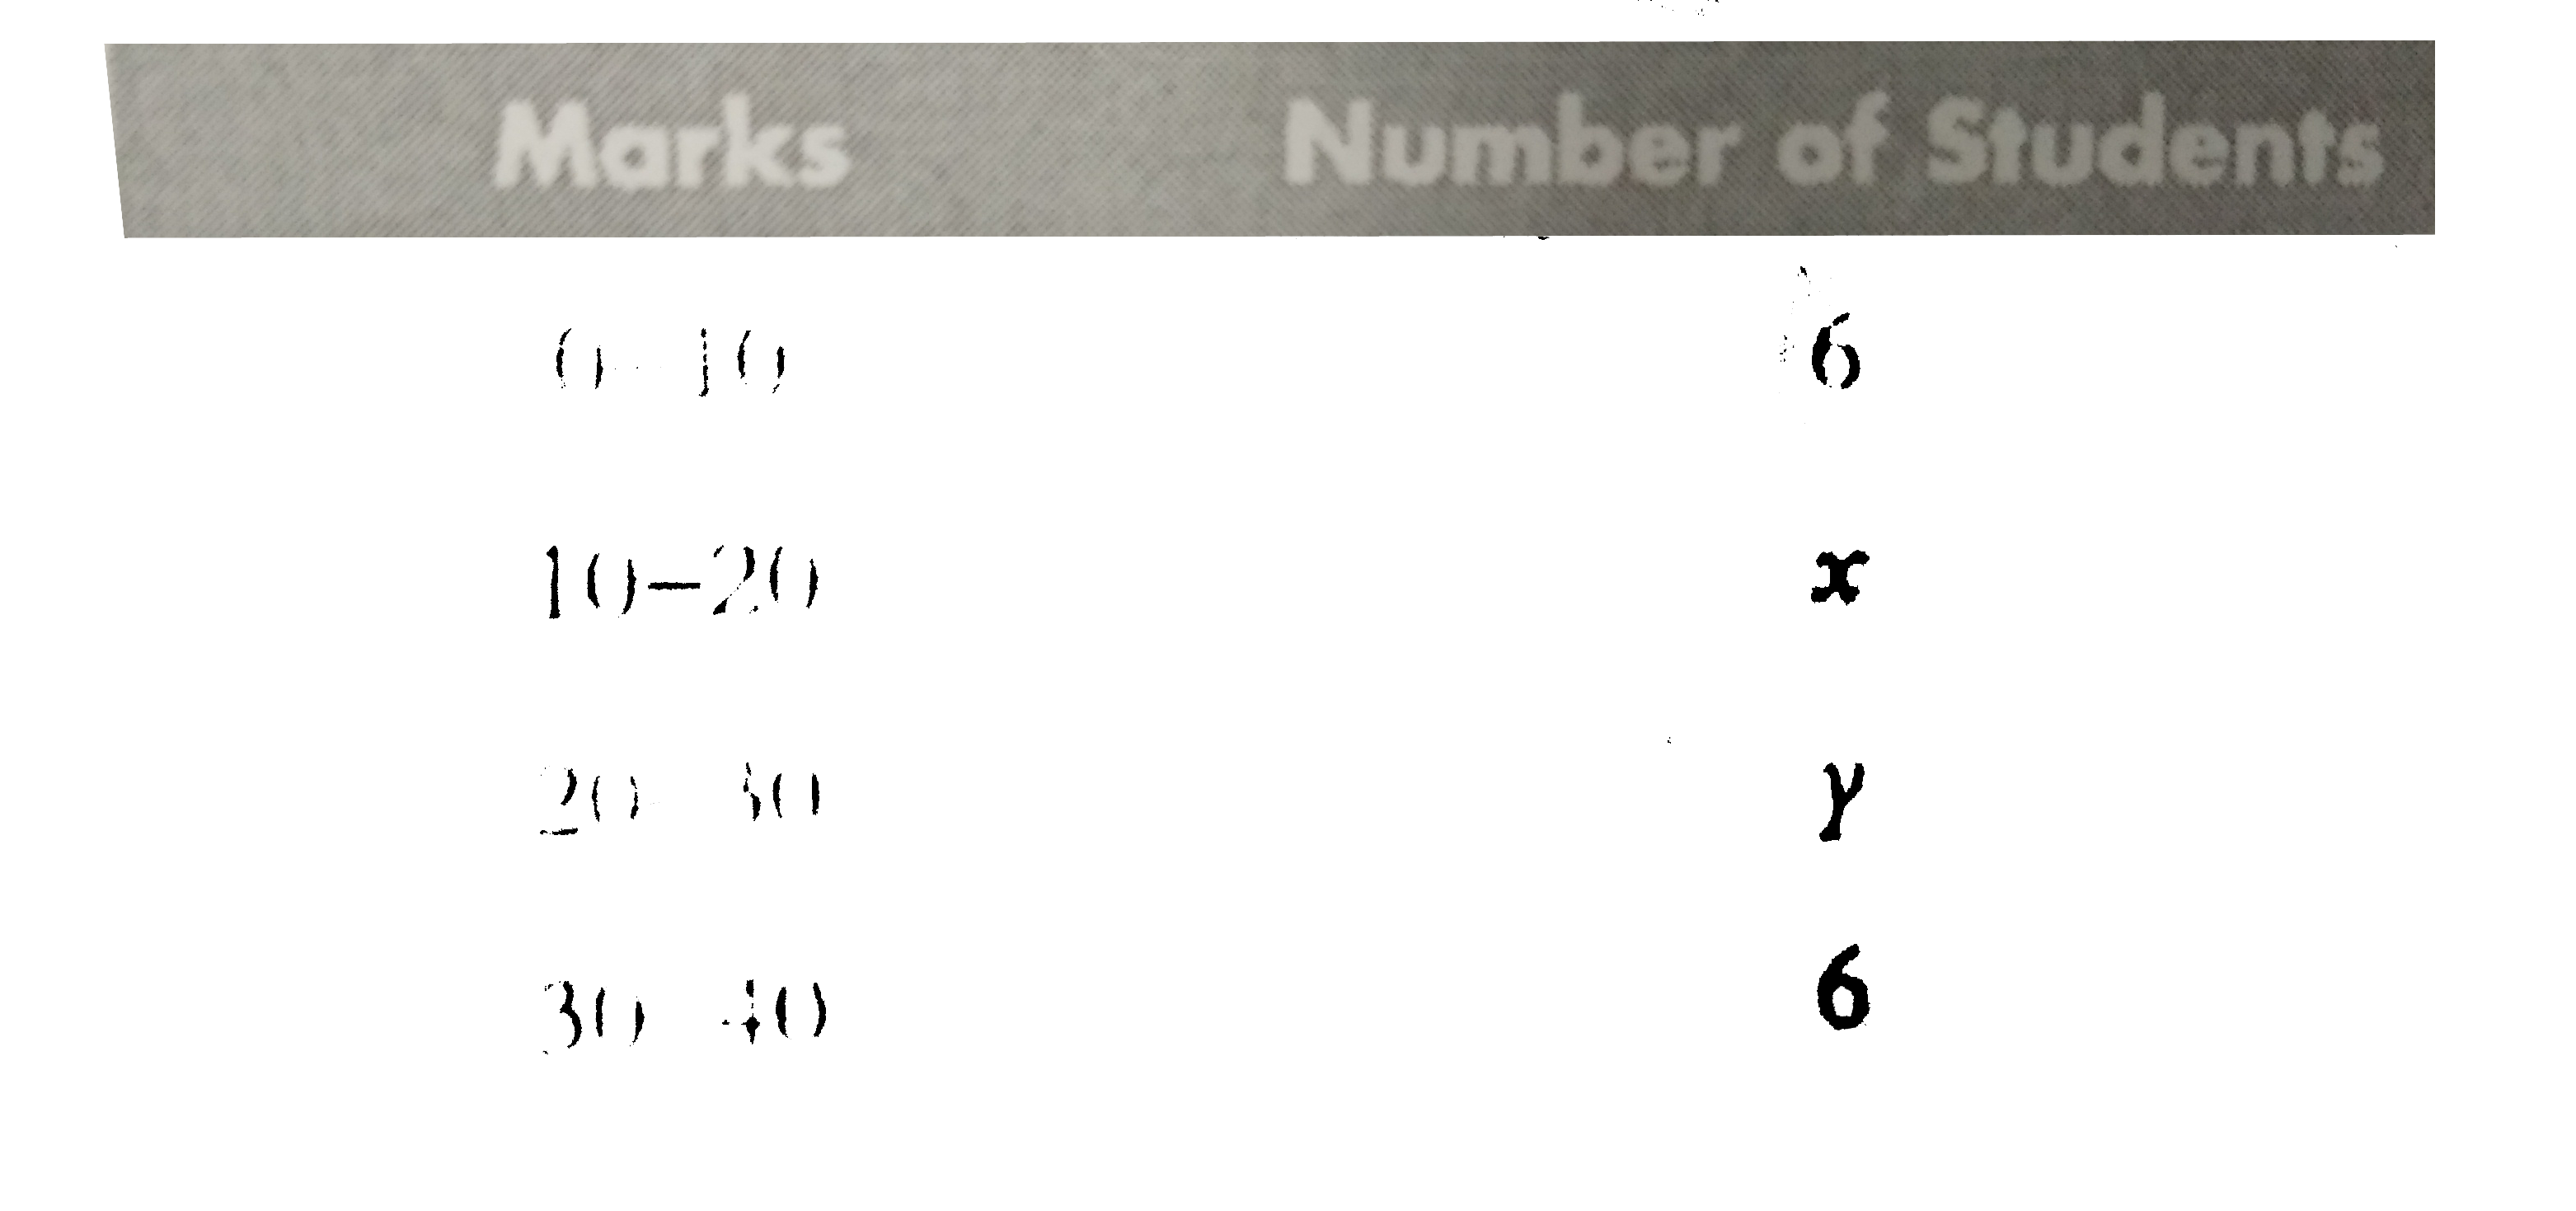
If the mean of the above data is 20 , then find the difference between x and y .
View SolutionThe histogram, given below, shows the number of families of a locality having various daily incomes, as obtained by a survey. Observe the graph and answer the questions based on it.
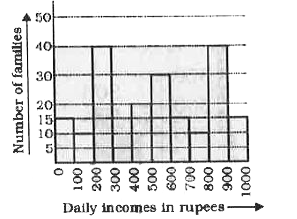
The number of families, whose daily incomes are Rs 800 or above, is
View SolutionThe histogram, given below, shows the number of families of a locality having various daily incomes, as obtained by a survey. Observe the graph and answer the questions based on it.
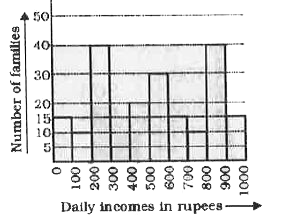
The number of families, whose daily incomes are between Rs 500 and Rs 800, is
View SolutionThe histogram, given below, shows the number of families of a locality having various daily incomes, as obtained by a survey. Observe the graph and answer the question based on it.
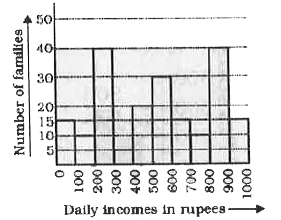
In all, how many families were surveyed ?
View Solution
