The double bar graph given below compares the class-averages in half yearly and annual examinations of 5 sections of Class VII.
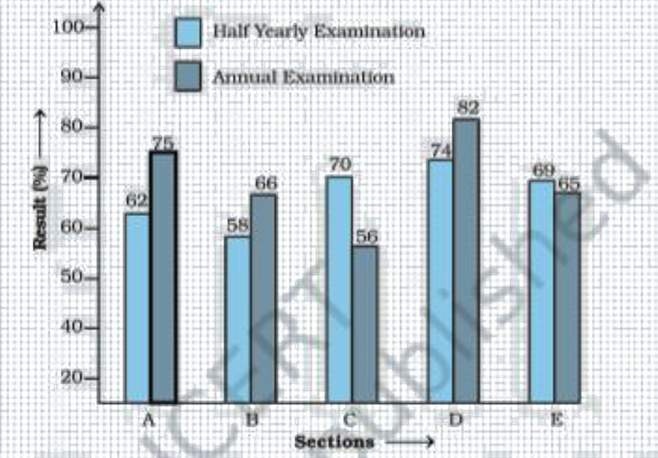
Observe the graph carefully and tell which section showed the most improvement and by how much?
The correct Answer is:13
Step by step video & image solution for The double bar graph given below compares the class-averages in half yearly and annual examinations of 5 sections of Class VII. Observe the graph carefully and tell which section showed the most improvement and by how much? by Maths experts to help you in doubts & scoring excellent marks in Class 7 exams.
Updated on:21/07/2023Topper's Solved these Questions
- DATA HANDLINGBOOK - NCERT EXEMPLARCHAPTER - DATA HANDLINGEXERCISE - EXERCISE(WRITE THE CORRECT ANSWER)
15 Videos
- DATA HANDLINGBOOK - NCERT EXEMPLARCHAPTER - DATA HANDLINGEXERCISE - EXERCISE(FILL IN THE BLANKS)
15 Videos
- DATA HANDLINGBOOK - NCERT EXEMPLARCHAPTER - DATA HANDLINGEXERCISE - EXAMPLES(TRUE OR FALSE)
3 Videos
- COMPARING QUANTITIESBOOK - NCERT EXEMPLARCHAPTER - COMPARING QUANTITIESEXERCISE - THINK AND DISCUSS
24 Videos
- EXPONENTS AND POWERSBOOK - NCERT EXEMPLARCHAPTER - EXPONENTS AND POWERSEXERCISE - EXERCISE
136 Videos
Similar Questions
The double bar graph given below compares the class-averages in half yearly and annual examinations of 5 sections of Class VII.
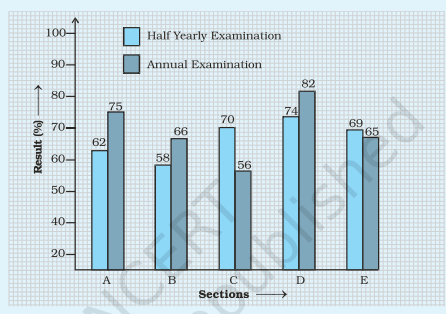
Can you compare the ratio of difference of results of sections B and D ?
View SolutionObserve this bar graph which shows the marks obtained by Aziz in half-yearly examination in different subjects.
View Solution
Knowledge Check
Study the double bar graph given below and answer the question.
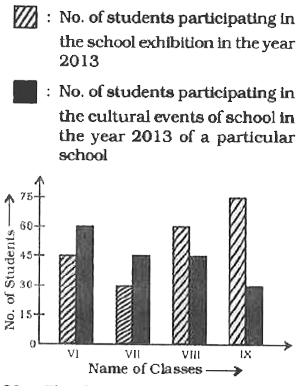
The class having maximum number of participants in exhibition isAClass IXBClass VIIICClass VIIDClass VIStudy the double bar graph given below and answer the questions.
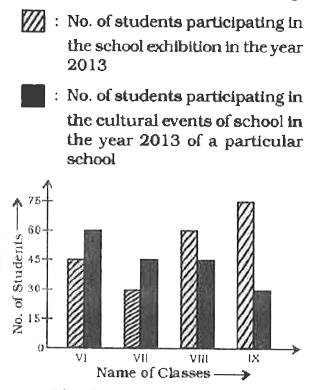
The ratio of the participants in exhibition of class IX with the total participants of class IX isA5:7B5:14C1:4D3:5
The graph given below compares the sales of ice creams of two vendors for a week.
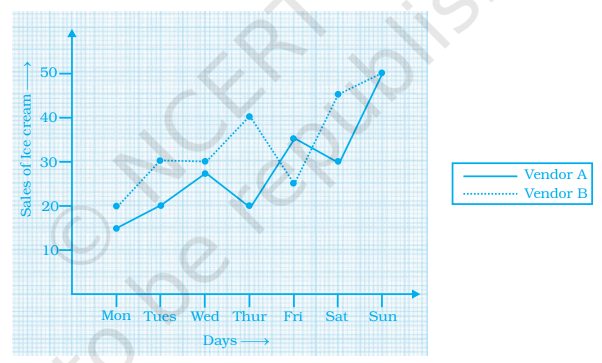
Observe the graph and answer the following questions.
(a) Which vendor has sold more icecreams on Friday?
(b) For which day was the sales same for both the vendors?
(c) On which day did the sale of vendor A increase the most as compared to the previous day?
(d) On which day was the difference in sales the maximum?
(e) On which two days was the sales same for vendor B?
View SolutionGiven below is a bar graph showing the marks obtained by Tarun in few subjects in an annual examination. Read the bar graph carefully and answer the question given below : In which subject does Taun get the lowest marks ? In which subject does Tarun get the highest marks ? How many marks does he get in English ? In which subjects does Tarun get less than 50 marks ?
View SolutionThe bar-graph given below shows the runs scored in six overs by a batsman.
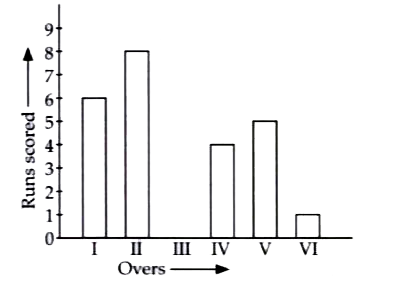
How many overs were there in which less than 3 runs were scored?
View SolutionStudy the double bar graph and answer the quesions that follow:
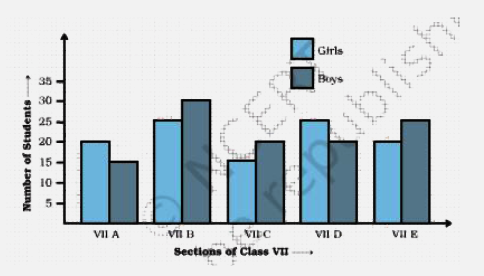
(a) What information does the double bar graph represent?
(b) Find the total number of boys in all sections of Class VII.
(c) In which sections, the number of girls is greater than the number of boys?
(d) In which section, the number of boys is the maximum?
(e) In which section, the number of girls is the least?
View SolutionThe line graph given below shows the yearly sales figures for a manufacturing company during the last five years.
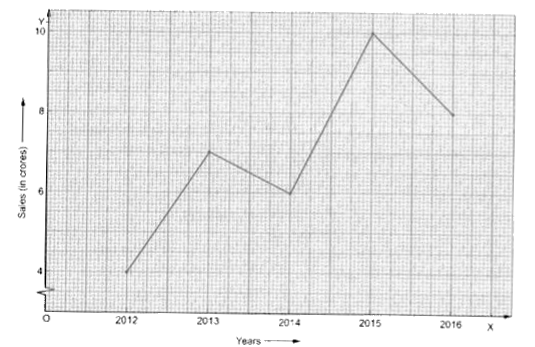
Study the above graph carefully and answer the questions given below :
(i) What are the sales in (a)2013 (b)2015 (c)2016 ?
(ii) Compute the difference between the sales in 2012 and 2016 ?
(iii) In which year was there the greatest difference between the sales as compared to its previous year?
View SolutionThe performance of a students is quarterly and half yearly examination is shown through the double bar graph
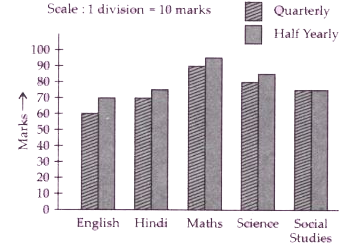
In which subject has t he student improved his performance the most
View Solution
