The performance of a students is quarterly and half yearly examination is shown through the double bar graph
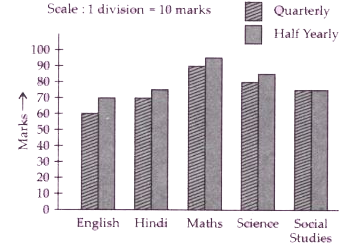
In which subject has t he student improved his performance the most
The correct Answer is:0
Step by step video & image solution for The performance of a students is quarterly and half yearly examination is shown through the double bar graph In which subject has t he student improved his performance the most by Maths experts to help you in doubts & scoring excellent marks in Class 7 exams.
Updated on:21/07/2023Topper's Solved these Questions
- DATA HANDLINGBook:MTG IIT JEE FOUNDATIONChapter:DATA HANDLINGExercise:Solved Examples
Explore 30 Videos
- DATA HANDLINGBook:MTG IIT JEE FOUNDATIONChapter:DATA HANDLINGExercise:NCERT Section (Exercise - 3 .1 )
Explore 23 Videos
- CONGRUENCE OF TRIANGLES Book:MTG IIT JEE FOUNDATIONChapter:CONGRUENCE OF TRIANGLES Exercise:Olympiad/HOTS Corner
Explore 10 Videos
- EXPONENTS AND POWERSBook:MTG IIT JEE FOUNDATIONChapter:EXPONENTS AND POWERSExercise:OLYMPIAD/HOTS CORNER
Explore 15 Videos
Similar Questions
The performance of a student in 1st Term and 2nd Term is given.

In which subject, has the child improved his performance the most ?
View SolutionThe performance of a student in 1st Term and 2nd Term is given.

In which subject is the improvement the least ?
View SolutionThe performance of a student in 1st Term and 2nd Term is given.

Has the performance gone down in any subject
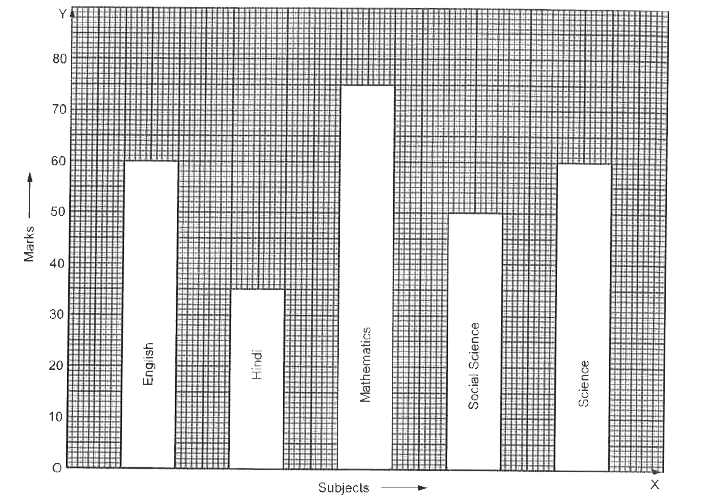
View SolutionLook at the bar graph given below.
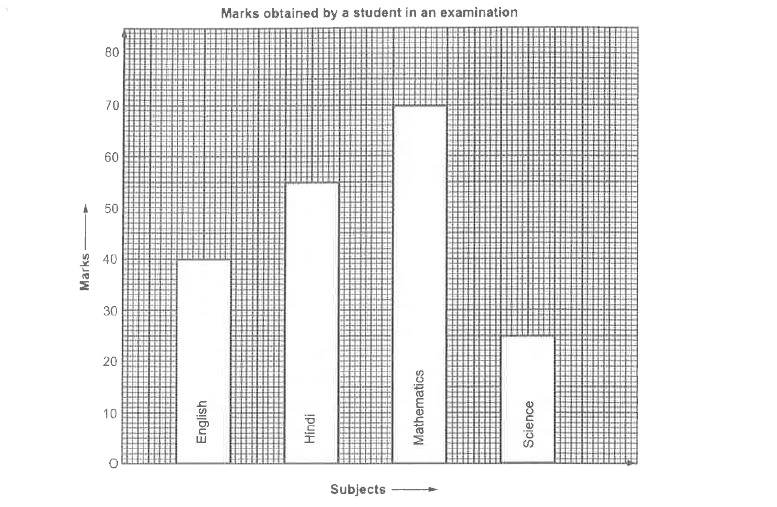
Read if cerefully and answer the questions given below:
What information does the bar graph give ?
In which subject is the student poorest ?
In which subject is the student best ?
In which subjects did he get more than 40 marks ?
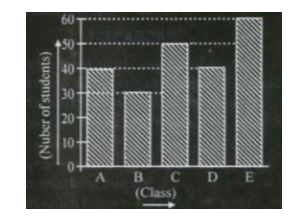
View SolutionFrom the following bar graph, find the class in which number of students are half of the other class :
View SolutionStudy the bar graph given below and answer the questions that follow
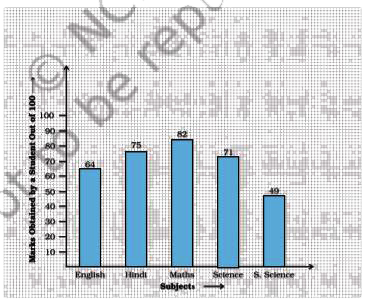
(a) What information is depicted from the bar graph?
(b) In which subject is the student very good?
(c) Calculate the average marks of the student.
(d) If 75 and above marks denote a distinction, then name the subjects in which the student got distinction.
(e) Calculate the percentage of marks the student got out of 500.
View SolutionLook at the bar graph given below
Read it carefully and answer the following questions
Q(i) What information does the bar graph give
(ii) In which subject is the student very good
(iii) In which subject is he poor
(iv) What is the average of his marks
View SolutionThe marks (out of 100) obtained by a student in his quarterly examination in various subjects are given below :
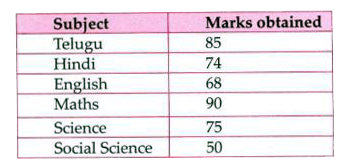
The total percentage of marks scored by the student is.
View SolutionThe double bar graph given below compares the class-averages in half yearly and annual examinations of 5 sections of Class VII.
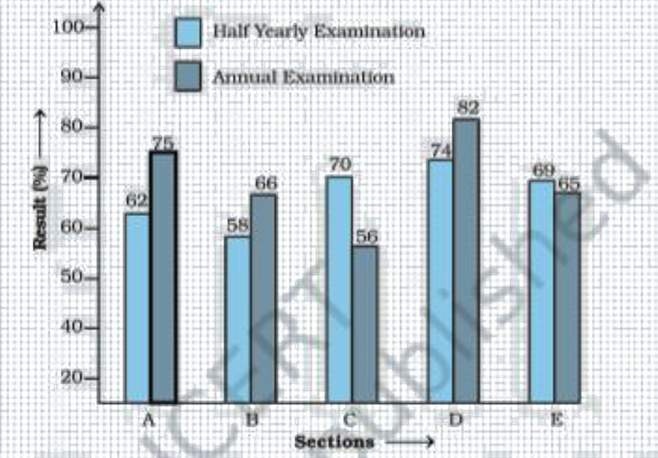
Observe the graph carefully and tell which section showed the most improvement and by how much?
View SolutionThe performance of 720 students in an examination for the academic year 2015-16 is shown in a pie chart. Study the pie chart carefully and answer the questions that follow.
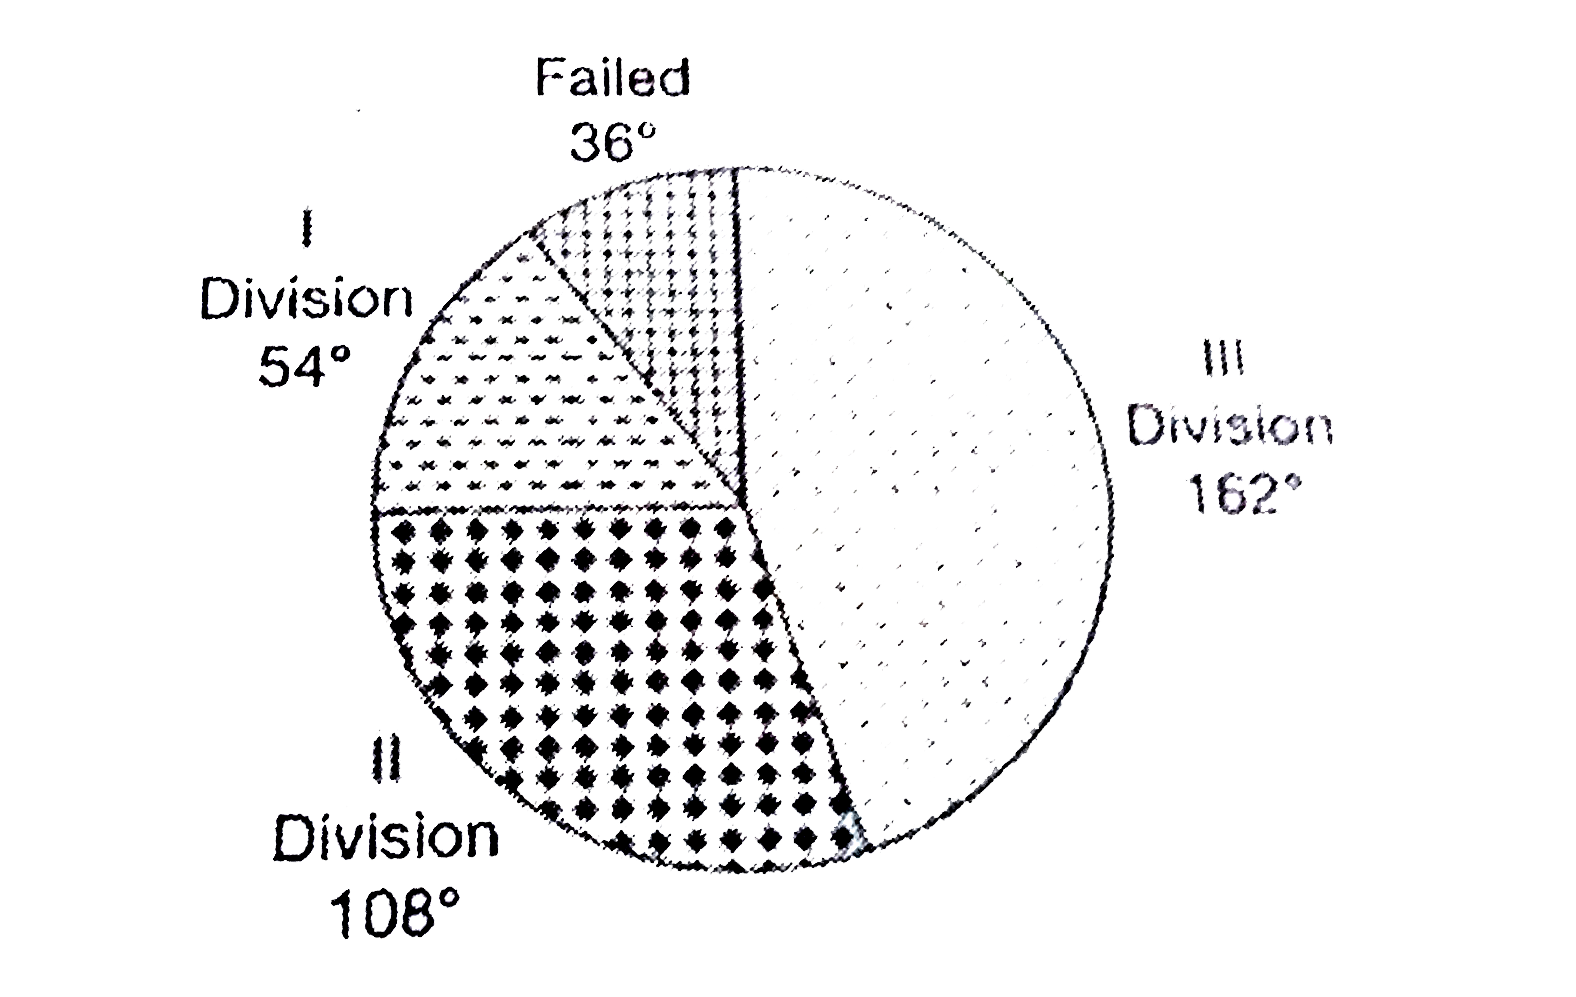
(i) Find the number of students who passed in the first division.
(ii) Find the ratio of number of students who passed to that of failed.
(iii) Find the pecentage of the number of students who failed in the examination.
View Solution
