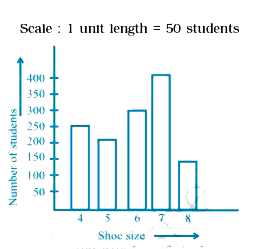
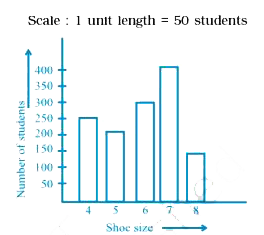
The following bar graph represents the data for different sizes of shoes worn by the students in a school. Read the graph and answer the following questions.
(a) Find the number of students whose shoe sizes have been collected.
To find the total number of students whose shoe sizes have been collected, we will follow these steps:
Step 1: Identify the shoe sizes and their corresponding number of students from the bar graph.
- Shoe size 4: 250 students
- Shoe size 5: 200 students
- Shoe size 6: 300 students
- Shoe size 7: 400 students
- Shoe size 8: 150 students
Step 2: Add the number of students for each shoe size to find the total.
We will perform the addition as follows:
1. Start with shoe size 4: 250
2. Add shoe size 5: 250 + 200 = 450
3. Add shoe size 6: 450 + 300 = 750
4. Add shoe size 7: 750 + 400 = 1150
5. Finally, add shoe size 8: 1150 + 150 = 1300
Step 3: State the total number of students.
The total number of students whose shoe sizes have been collected is 1300.
---
- Shoe size 4: 250 students
- Shoe size 5: 200 students
- Shoe size 6: 300 students
- Shoe size 7: 400 students
- Shoe size 8: 150 students
We will perform the addition as follows:
2. Add shoe size 5: 250 + 200 = 450
3. Add shoe size 6: 450 + 300 = 750
4. Add shoe size 7: 750 + 400 = 1150
5. Finally, add shoe size 8: 1150 + 150 = 1300
The total number of students whose shoe sizes have been collected is 1300.
Topper's Solved these Questions
Similar Questions
The following bar graph represents the data for different sizes of shoes worn by the students in a school. Read the graph and answer the following questions.
What is the number of students wearing shoe size 6?
View SolutionThe following bar graph represents the data for different sizes of shoes worn by the students in a school. Read the graph and answer the following questions.
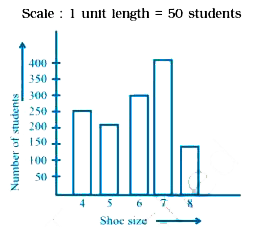
Which shoe size is worn by minimum number of students?
View SolutionThe following bar graph represents the data for different sizes of shoes worn by the students in a school. Read the graph and answer the following questions.
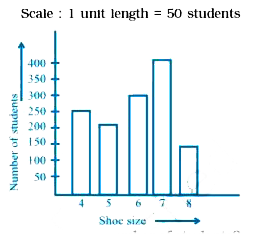
Which shoe size is worn by the maximum number of students?
View SolutionThe following bar graph represents the data for different sizes of shoes worn by the students in a school. Read the graph and answer the following questions.
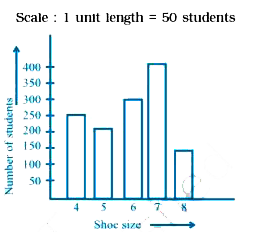
What are the different sizes of the shoes worn by the students?
View SolutionThe following bar graph represents the data for different sizes of shoes worn by the students in a school. Read the graph and answer the following questions.
State whether true or false:
The total number of students wearing shoe sizes 5 and 8 is the same as the number of students wearing shoe size 6.
View SolutionRead the graph and answer the following questions
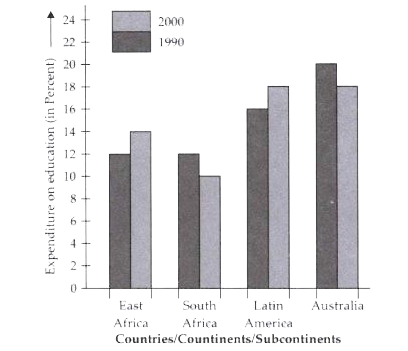
Give a suitable title to bar graph
View SolutionRead the bar graph given below and answer the following questions:

In which year is the number of students maximum?
View SolutionUse the bar graph to answer the following questions
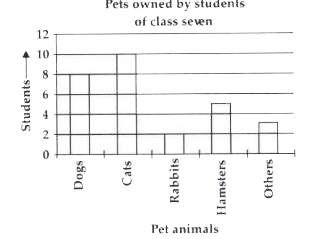
How many students have dog as a pet ?
View SolutionRead the graph and answer the following questions
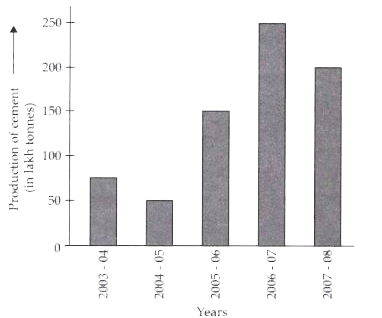
What information is conveyed by the bar graph
View SolutionRead the bar graph given below and answer the following questions:

In which year is the number of students twice as that of 2001-02?
View Solution
