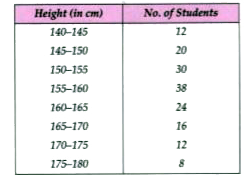
The following distributions represent the height of 160 studens of a class :

Find the modal height
The correct Answer is:156.82
Step by step video & image solution for The following distributions represent the height of 160 studens of a class : Find the modal height by Maths experts to help you in doubts & scoring excellent marks in Class 10 exams.
Updated on:21/07/2023Topper's Solved these Questions
- STATISTICS BOOK - NAGEEN PRAKASHAN ENGLISHCHAPTER - STATISTICS EXERCISE - Exercise 14 D
5 Videos
- STATISTICS BOOK - NAGEEN PRAKASHAN ENGLISHCHAPTER - STATISTICS EXERCISE - EXERCISE 14 E
5 Videos
- STATISTICS BOOK - NAGEEN PRAKASHAN ENGLISHCHAPTER - STATISTICS EXERCISE - Exercise 14 B
7 Videos
- SOME APPLICATIONS OF TRIGONOMETRYBOOK - NAGEEN PRAKASHAN ENGLISHCHAPTER - SOME APPLICATIONS OF TRIGONOMETRYEXERCISE - Long Answer Questions
5 Videos
- TRIANGLES BOOK - NAGEEN PRAKASHAN ENGLISHCHAPTER - TRIANGLES EXERCISE - Revision Exercise Long Questions
1 Videos
Similar Questions
The following distribution represents the height of 160 students of a school.

Draw an ogive for the given distribution taking 2 cm = 5 cm of height on one axis and 2 cm = 20 cm students on the other axis. Using the graph, determine.
(i) The median height.
View SolutionFind the unknown entries (a,b,c,d,e,f,g) from the following frequency distribution of heights of 50 students in a class: Class intervals (heights in cm) Frequency Cumulative Frequency 150-155 155-160 160-165 165-170 170-175 175-180 12 b 10 d e 2 a 25 c 43 48 f
View SolutionGiven below is the frequency distribution of the heights of playces in a school :

Find the modal height
View SolutionThe following is the distribution of height of students of a certain class in a certain city: Height (in cms): 160-162 163-165 166-168 169-171 172-174 No. of students: 15 118 142 127 18. Find the average height of maximum number of students.
View SolutionThe following is the distribution of height of students of a certain class in a certain city:
Height (in cms) 160−162 163−165 166−168 169−171 172−174No. of students 15 118 142 127 18
Find the median height.
View SolutionGiven below is the frequency distribution of the heights of 50 students of a class: Class Interval:, 140-145, 145-150, 150-155, 155-160, 160-165 Frequency:, 8, 12, 18, 10, 5 Draw a histogram representing the above data.
View SolutionThe following bar graph (Figure) represents the heights (in cm) of 50 students of Class XI of a particular school. Study the graph and answer the following questions: What percentage of the total number of students have their heights more than 149 cm? How many students in the class are in the range of maximum height of the class? The school wants to provide a particular type of tonic to each student below the height of 150cm to improve his height. If the cost of the tonic for each student comes out to be Rs. 55, how much amount of money is required? How many students are in the range of shortest height of the class? State whether true or false: There are 9 students in the class whose heights are in the range of 155-159 cm. Maximum height (in cm) of a student in the class is 17. There are 29 students in the class whose heights are in the range of 145-154 cm. Minimum height (in cm) of a student is the class is in the range of 140-144cms. The number of students in the class having their heights less than 150cm is 12. There are 14 students each of whom has height more than 154 cm.
View SolutionFor the following distribution

the modal class is
View SolutionThe following table shows the frequency distribution of heights of 50 boys: Find the mode of heights
View SolutionThe following table shows the heights of 50 students of a class :
Height (in cm)152148150153149151147Number of students834712106
Find the mean and the median.
Using empirical formula, calculate its mode.
View Solution
