The following data gives the distribution of total household expendilture ( in Rs.) of workers is a city :

Find the average expenditure which is being done by maximum number of manual workers.
The correct Answer is:1820
Step by step video & image solution for The following data gives the distribution of total household expendilture ( in Rs.) of workers is a city : Find the average expenditure which is being done by maximum number of manual workers. by Maths experts to help you in doubts & scoring excellent marks in Class 10 exams.
Updated on:21/07/2023Topper's Solved these Questions
- STATISTICS Book:NAGEEN PRAKASHAN ENGLISHChapter:STATISTICS Exercise:Exercise 14 D
Explore 5 Videos
- STATISTICS Book:NAGEEN PRAKASHAN ENGLISHChapter:STATISTICS Exercise:EXERCISE 14 E
Explore 5 Videos
- STATISTICS Book:NAGEEN PRAKASHAN ENGLISHChapter:STATISTICS Exercise:Exercise 14 B
Explore 7 Videos
- SOME APPLICATIONS OF TRIGONOMETRYBook:NAGEEN PRAKASHAN ENGLISHChapter:SOME APPLICATIONS OF TRIGONOMETRYExercise:Long Answer Questions
Explore 5 Videos
- TRIANGLES Book:NAGEEN PRAKASHAN ENGLISHChapter:TRIANGLES Exercise:Revision Exercise Long Questions
Explore 1 Video
Similar Questions
The following data gives the distribution of total household expenditure (in rupees) of manual workers in a city: Expenditure (Rs.) Frequency Expenditure ( Rs.) Frequency 1000-1500 24 3000-3500 30 1500-2000 40 3500-4000 22 2000-2500 33 4000-4500 16 2500-3000 28 4500-5000 7 Find the average expenditure which is being done by the maximum number of manual workers.
View SolutionThe following data gives the distribution of total monthly household expenditure of 200 families of a village. Find the modal monthly expenditure of the families. Also, find the mean monthly expenditure:
View Solution
Knowledge Check
The following table gives the number of households in USA during 2000-2014.
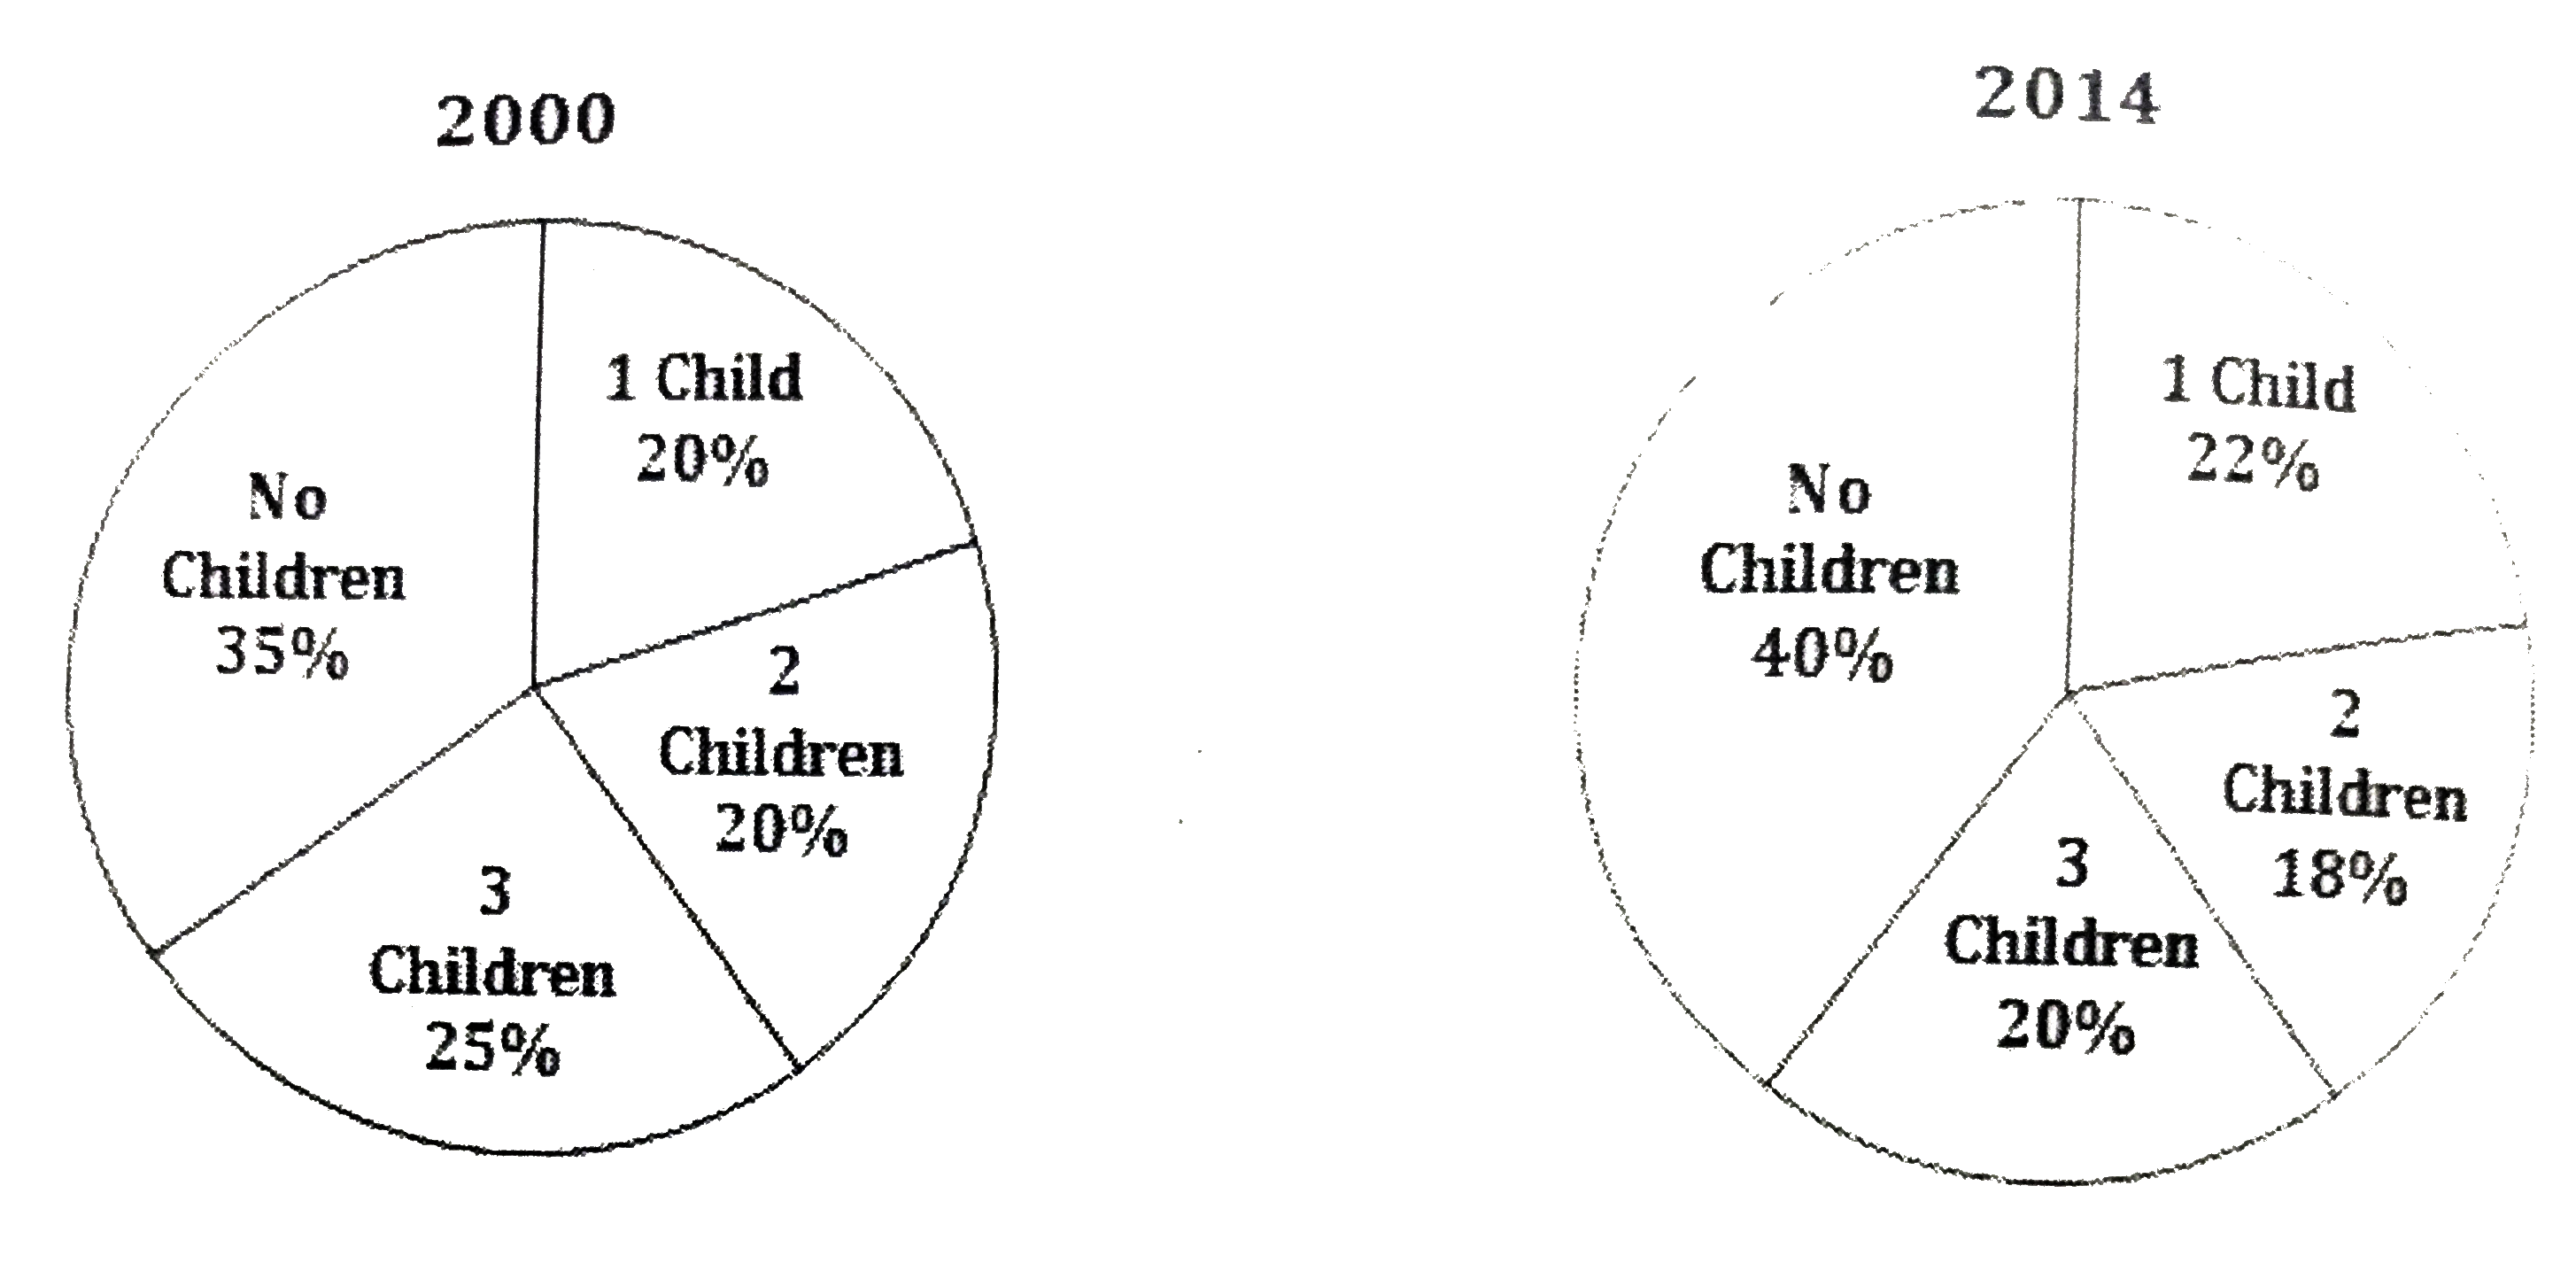
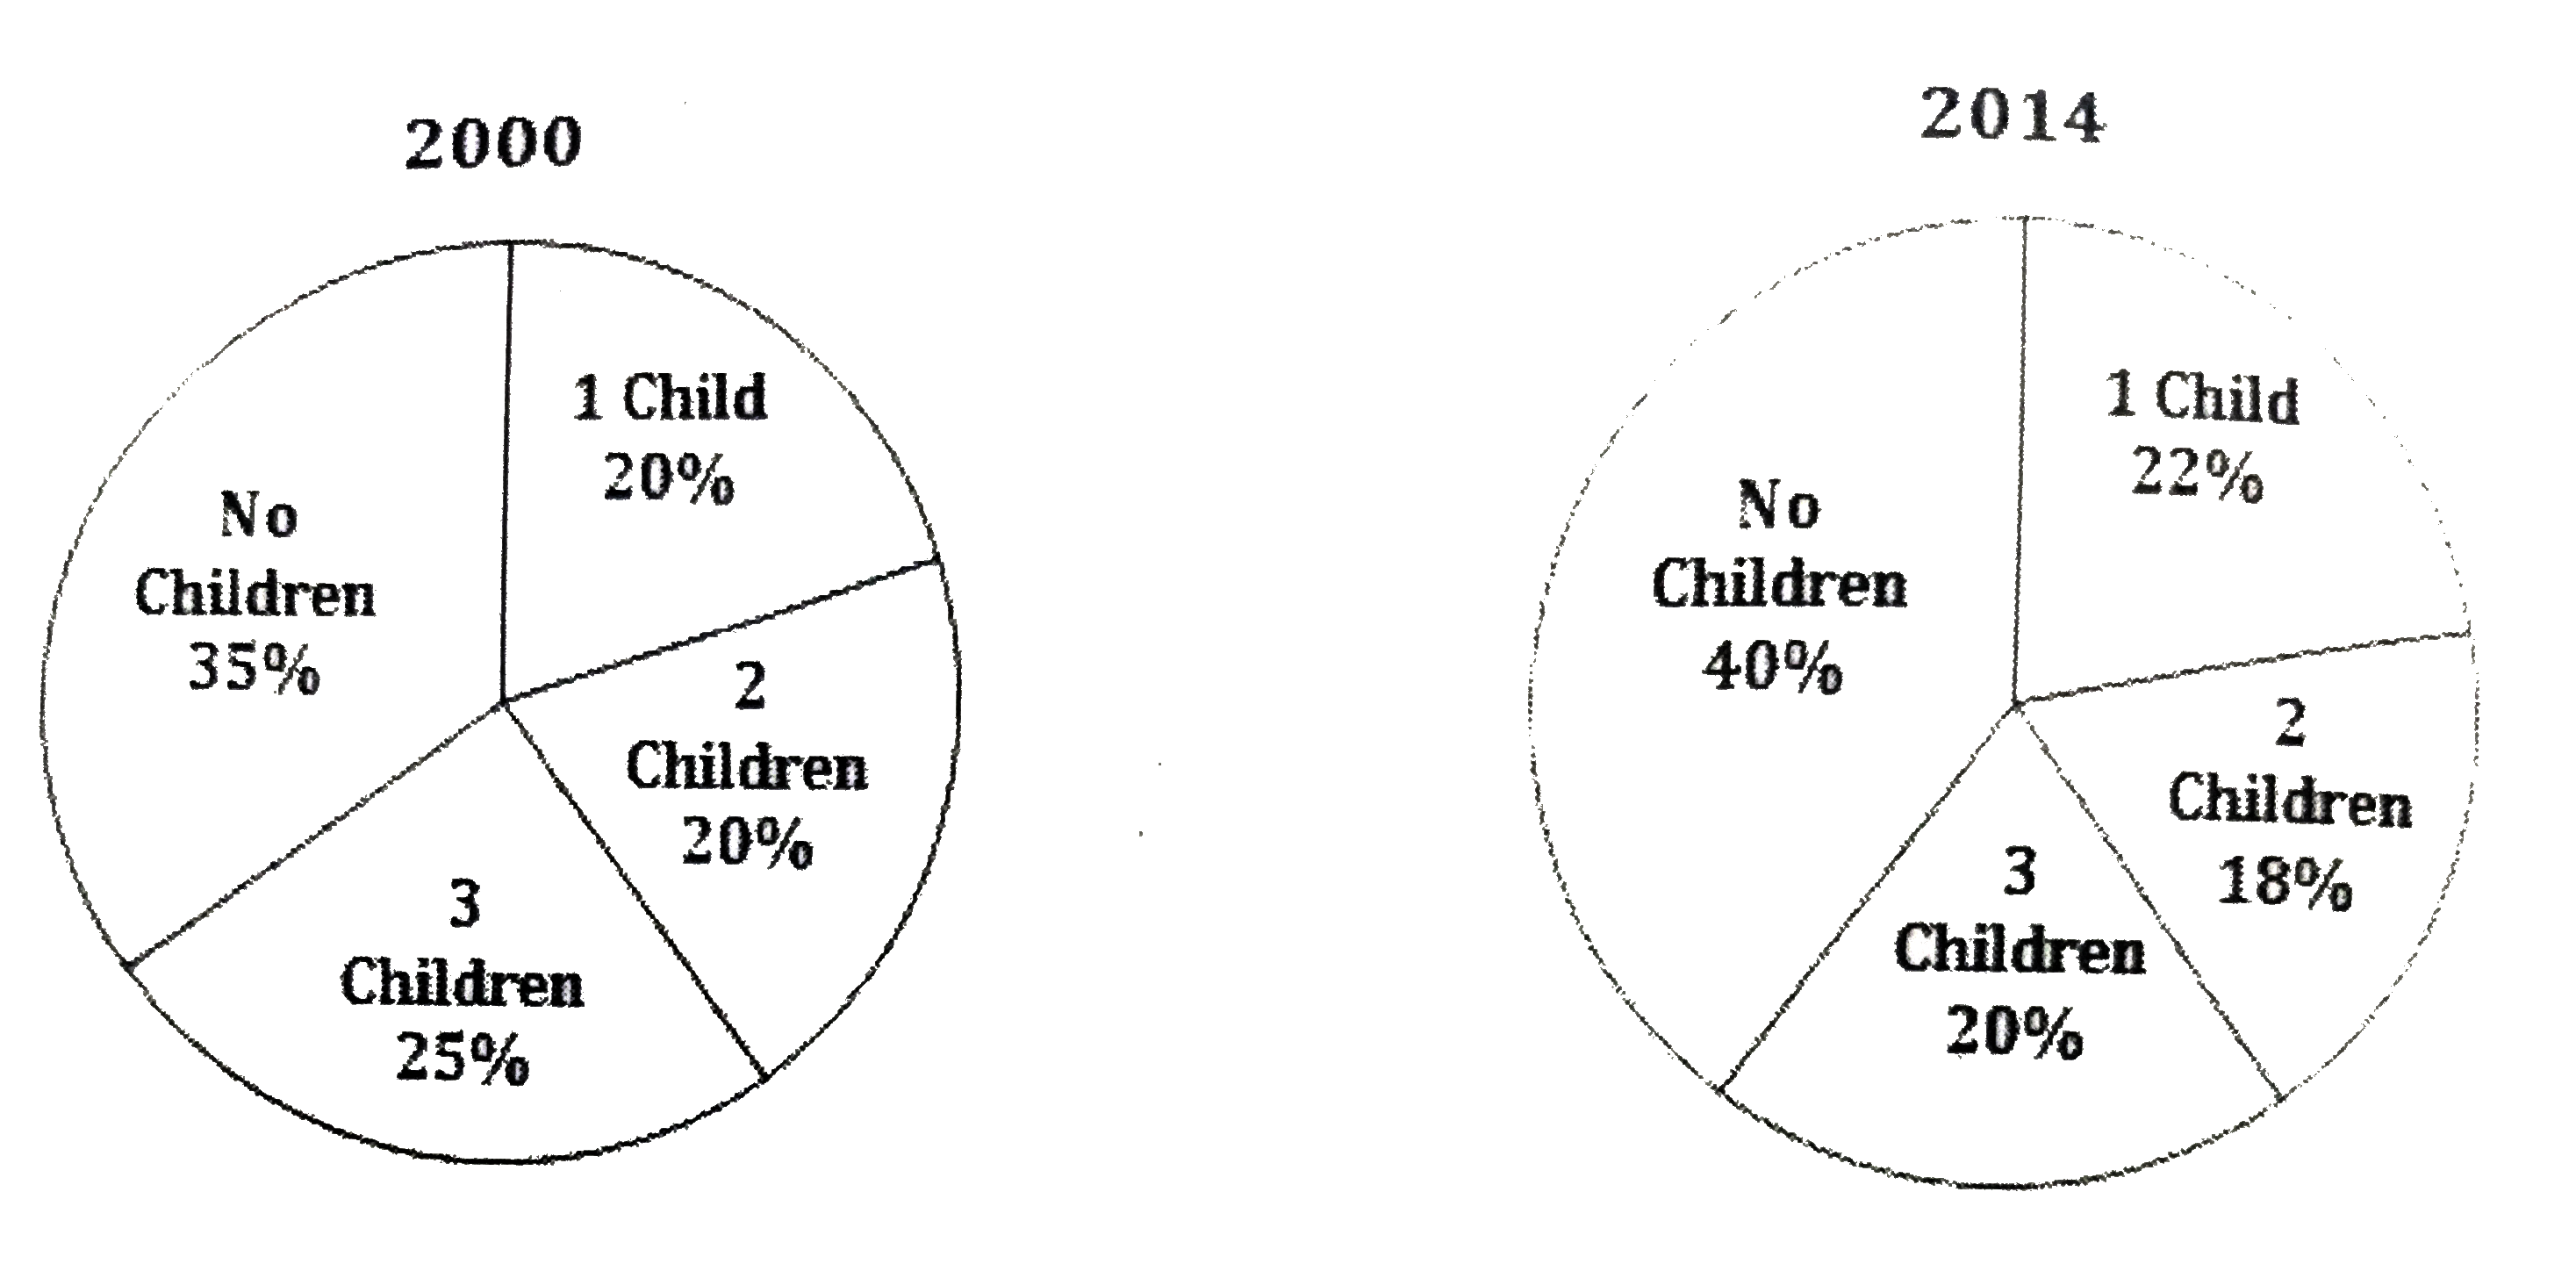
The following charts give the distribution of households based on the numbers of children for the years 2000 and 2014.

The following charts give the distribution based on the number of childre for the year 2000 and 2014.

What is the total number of children in 2014?A57.0 millionB129.5 millionC171.1 millionD201.4 millionThe following table gives the number of households in USA during 2000-2014.
The following charts give the distribution of households based on the numbers of children for the years 2000 and 2014.

The following charts give the distribution based on the number of childre for the year 2000 and 2014.

What was the approximate average annual percent increase in the number of households form 2000 to 2014 ?A1.5%B1.4%C1.2%D1.1%
The following data gives the distribution of total monthly household expenditure of 200 families of a village. Find the modal monthly expenditure of the families. Also, find the mean monthly expenditure: Expenditure (Rs.) Frequency Expenditure (Rs.) Frequency 1000-1500 24 3000-3500 30 1500-2000 40 3500-4000 22 2000-2500 33 4000-4500 16 2500-3000 28 4500-5000 7
View SolutionThe following table gives the distribution of total household expenditure (in rupees) of manual workers in a city. Expenditure (in rupees) (xi) Frequency (fi) 100-150 24 150-200 40 200-250 33 250-300 28 300-350 30 350-450 22 400-450 16 450-500 7 Find the average expenditure (in rupees) per household.
View SolutionIn the following table, the total expenditure of the labourers of a city is given Find the average expenditure by deviation method.
View SolutionThe following table gives the distribution of total household expenditure (in rupees) of manual workers in a city. Expenditure: (in Rs.) 100-150 150-200 200-250 250-300 300-350 350-400 400-450 450-500 Frequency: 24 40 33 28 30 22 16 7 Find the average expenditure (in Rs.) per household.
View SolutionThe following histogram shows the monthly wages (in Rs.) of workers in a factory: Figure Find the largest and least number of workers and also their wages in rupees.
View SolutionThe following table gives the number of finished articles turned out per day be different number of workers in a factors. Find the standard deviation of the daily output of finished articles. Find the variance and standard deviation of the following frequency distribution: Number of article:, 18, 19, 20, 21, 22, 23, 24, 25, 26, 27 No. of workers:, 3, 7, 11, 14, 18, 17, 13, 8, 5, 4
View Solution
