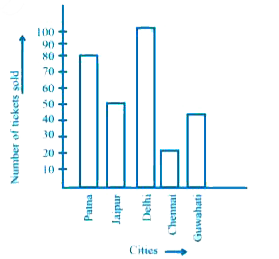
The following graph gives the information about the number of railway tickets sold for different cities on a railway ticket counter between 6.00 am to 10.00 am. Read the bar graph and answer the following questions.
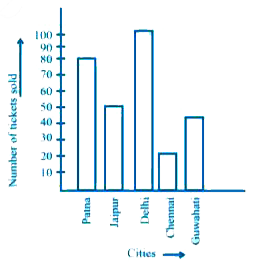
Name the cities for which the number of tickets sold is more than 20.
Step by step video & image solution for The following graph gives the information about the number of railway tickets sold for different cities on a railway ticket counter between 6.00 am to 10.00 am. Read the bar graph and answer the following questions. Name the cities for which the number of tickets sold is more than 20. by Maths experts to help you in doubts & scoring excellent marks in Class 6 exams.
Updated on:21/07/2023Topper's Solved these Questions
Similar Questions
The following graph gives the information about the number of railway tickets sold for different cities on a railway ticket counter between 6.00 am to 10.00 am. Read the bar graph and answer the following questions.
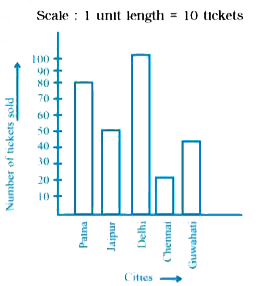
For which city were the minimum number of tickets sold?
View SolutionThe following graph gives the information about the number of railway tickets sold for different cities on a railway ticket counter between 6.00 am to 10.00 am. Read the bar graph and answer the following questions.
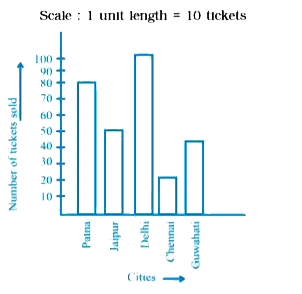
For which city were the maximum number of tickets sold?
View SolutionThe following graph gives the information about the number of railway tickets sold for different cities on a railway ticket counter between 6.00 am to 10.00 am. Read the bar graph and answer the following questions.
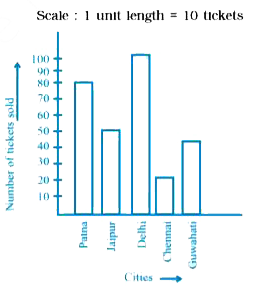
How many tickets were sold in all?
View SolutionThe following graph gives the information about the number of railway tickets sold for different cities on a railway ticket counter between 6.00 am to 10.00 am. Read the bar graph and answer the following questions.
Fill in the blanks:
Number of tickets sold for Delhi and Jaipur together exceeds the total number of tickets sold for Patna and Chennai by _____
View SolutionRead the bar graph given below and answer the following questions:
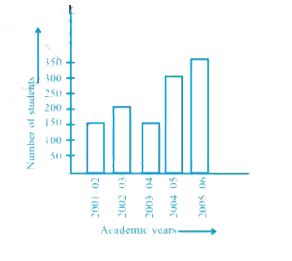
In which year is the number of students maximum?
View SolutionLook at the bar graph and answer the following questions.
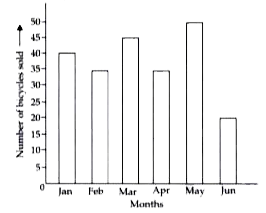
In which month 40 bicycles were sold?
View SolutionStudy the bar graph and answer the following questions.
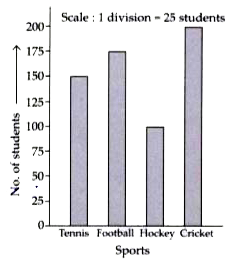
What is the difference between number of students playing football and hockey ?
View SolutionRead the bar graph given below and answer the following questions:

In which year is the number of students twice as that of 2001-02?
View SolutionRead the bar graph carefully and answer the following questions.
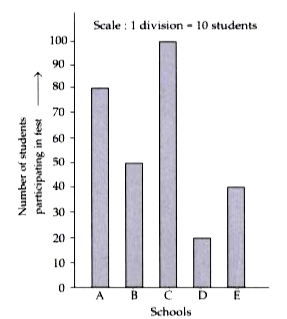 From which school maximum number of students participated ?
View SolutionLook at the bar graph and answer the following questions.
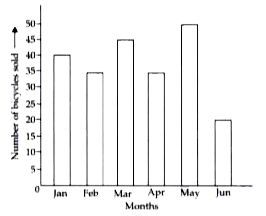
How many less bicycles sold in June than in March?
View Solution
