Look at the bar graph and answer the following questions.
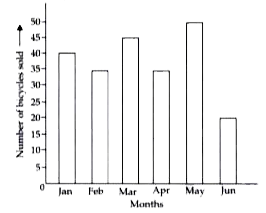
In which month 40 bicycles were sold?
January
February
April
May
The correct Answer is:A
Step by step video & image solution for Look at the bar graph and answer the following questions. In which month 40 bicycles were sold? by Maths experts to help you in doubts & scoring excellent marks in Class 6 exams.
Updated on:21/07/2023Topper's Solved these Questions
- DATA HANDLING BOOK - MTG IIT JEE FOUNDATIONCHAPTER - DATA HANDLING EXERCISE - Exercise (Match the following)
2 Videos
- DATA HANDLING BOOK - MTG IIT JEE FOUNDATIONCHAPTER - DATA HANDLING EXERCISE - Exercise (Assertion & Reason Type )
5 Videos
- DATA HANDLING BOOK - MTG IIT JEE FOUNDATIONCHAPTER - DATA HANDLING EXERCISE - Exercise (Multiple Choice Questions) Level -1
35 Videos
- BASIC GEOMETRICAL IDEASBOOK - MTG IIT JEE FOUNDATIONCHAPTER - BASIC GEOMETRICAL IDEASEXERCISE - OLYMPIAD/HOTS CORNER
10 Videos
- DECIMALSBOOK - MTG IIT JEE FOUNDATIONCHAPTER - DECIMALSEXERCISE - OLYMPIAD/HOTS CORNER
20 Videos
Similar Questions
Look at the bar graph and answer the following questions.
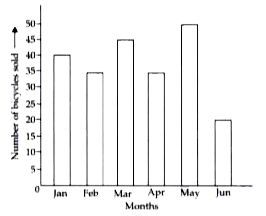
How many less bicycles sold in June than in March?
View SolutionThe following graph gives the information about the number of railway tickets sold for different cities on a railway ticket counter between 6.00 am to 10.00 am. Read the bar graph and answer the following questions.
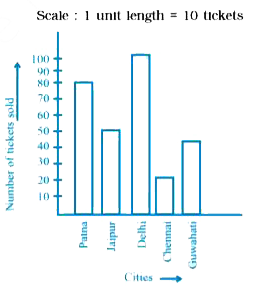
How many tickets were sold in all?
View SolutionStudy the bar graph and answer the following questions.
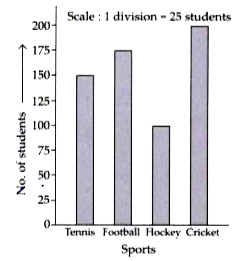
Which sport is preferred least ?
View SolutionStudy the bar graph and answer the following questions.
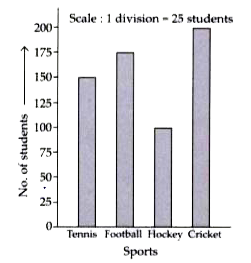
Which is the most popular sport ?
View SolutionThe following graph gives the information about the number of railway tickets sold for different cities on a railway ticket counter between 6.00 am to 10.00 am. Read the bar graph and answer the following questions.
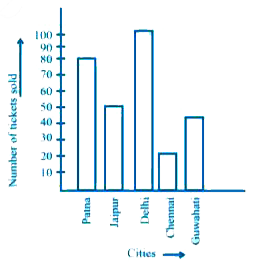
Name the cities for which the number of tickets sold is more than 20.
View SolutionThe bar graph showns the number of motorcycles of different brands sold by a dealer in a month . Study the diagram and answer the following questions.
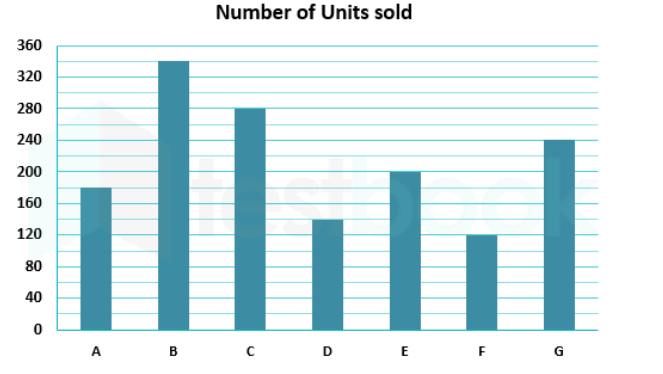
Units sold of which Motorcycle brand were the second highest?
View SolutionThe following graph gives the information about the number of railway tickets sold for different cities on a railway ticket counter between 6.00 am to 10.00 am. Read the bar graph and answer the following questions.
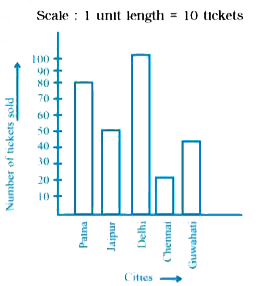
For which city were the minimum number of tickets sold?
View SolutionThe following graph gives the information about the number of railway tickets sold for different cities on a railway ticket counter between 6.00 am to 10.00 am. Read the bar graph and answer the following questions.
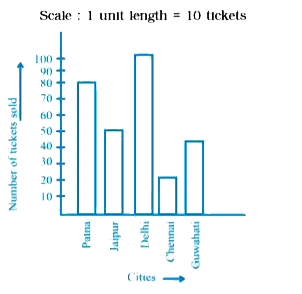
For which city were the maximum number of tickets sold?
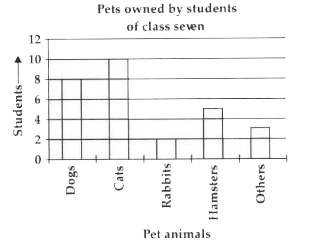
View SolutionUse the bar graph to answer the following questions
Which is the most popular pet ?
View SolutionTwo different models of TV sets are produced in a factory and are given below as a double bar graph. Read the data and answer the following questions:
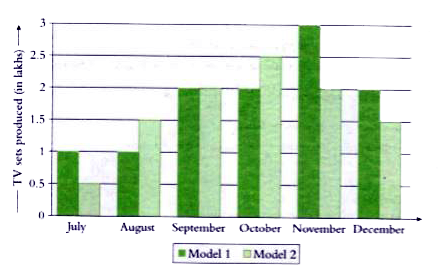
In which month, both the models of TV sets produced are equal?
View Solution
