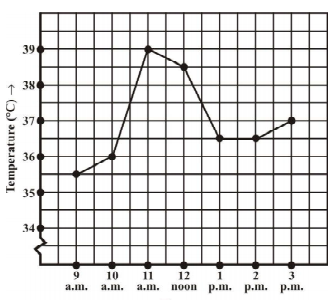
The following graph shows the tempreature of a patient in a hospital,recorded every hour.
When was the patient's temperature was the same two times during the period is given.What were these two times?
 Solution in Punjabi
Step by step video & image solution for The following graph shows the tempreature of a patient in a hospital,recorded every hour.When was the patient's temperature was the same two times during the period is given.What were these two times? by Maths experts to help you in doubts & scoring excellent marks in Class 8 exams.
Updated on:21/07/2023Topper's Solved these Questions
Similar Questions
Plot the points(5,0),(0.5),(2,5),(5,2)and (6,3) in the cartesian plane by using a graph paper.
View SolutionFind the H.C.F. of the following :
2xy,6x2y3,8x3y2.
View SolutionWhen water freezes its volume increases by 4%.What volumeof water is required to make 221cm3 of ice?
View SolutionWhich of the following are correct chain isomers of butane ? (i)
View SolutionDetermine the point of symmetry of a regular hexagon.
View SolutionDtermine the images of the following figure about the given line :
View SolutionMatch the following Column A to Column B

View SolutionMatch the following Column A to Column B

View SolutionMatch the following Column A to Column B

View SolutionThe inequation represented by the graph given below is :
View SolutionThe inequation that best describes the graph given below is _________
View SolutionThe inequation that best describes the following graph is _________
View SolutionWhich inequations represent the shaded region in the given figure
View SolutionA system is shown in the figure. The time period for small oscillations of the two bolcks will be :- ltimg src="https://d10lpgp6xz60nq.cloudfront.net/physics_images/ALN_PHY_R02_E10_014_Q01.png" width="80%"gt
View SolutionThe following graph shows the temperature of a patient in a hospital,recorded every hour: (a)What was the patients temperature at 1 p.m? (b)When was the patient's temperature 38.5^@ C? (c)The patient's temperature was the samae two times during the period given.What were these two times? (d)What was the temperature at 1.30 p.m?How did you arrive at your answer? (e)During which periods did the patients temperature showed an upward trend?
View SolutionThe following graph shows the temperature of a patient in a hospital, recorded every hour.
 The patient’s temperature was the same two times during the period given. What were these two times?
View Solution
