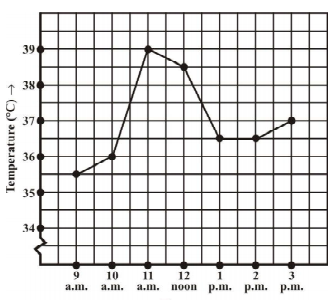
The following graph shows the temperature of a patient in a hospital, recorded every hour.
 The patient’s temperature was the same two times during the period given. What were these two times?Solution in Punjabi
Step by step video & image solution for The following graph shows the temperature of a patient in a hospital, recorded every hour. The patient’s temperature was the same two times during the period given. What were these two times? by Maths experts to help you in doubts & scoring excellent marks in Class 8 exams.
Topper's Solved these Questions
Similar Questions
Plot the point (4, 3) on a graph sheet. Is it the same as the point (3, 4)?
02:05View SolutionFind the common factors of the given terms : 12x,36
06:07View SolutionSolve the following equations. x – 2 = 7
02:11View SolutionThe following graph show the temprature of a patient in a hospital, recorded every hour, (a) What was the patient's temperature at 1 p.m.? *b) When was the patient's temperature 38.5∘C ? (j) The patient’s temperature was the same two times during the period given. What were these two times? (k) What was the temperature at 1.30 p.m.? How did you arrive at your answer? (l) During which periods did the patients’ temperature showed an upward trend?
01:31View SolutionWhich of the following are correct chain isomers of butane ? (i)
02:45View SolutionDetermine the point of symmetry of a regular hexagon.
02:17View SolutionDtermine the images of the following figure about the given line :
05:41View SolutionMatch the following Column A to Column B
 02:21View Solution
Match the following Column A to Column B
 02:03View Solution
Match the following Column A to Column B
 02:10View Solution
Find the area of the figure given below.
 02:17View Solution
The area of the shaded part in the figure given below is ______.
 02:10View Solution
The inequation represented by the graph given below is :
04:23View SolutionThe inequation that best describes the graph given below is _________
02:34View SolutionThe inequation that best describes the following graph is _________
02:24View SolutionWhich inequations represent the shaded region in the given figure
03:10View Solution

