The following is the distance -time graph of Amit's walking.
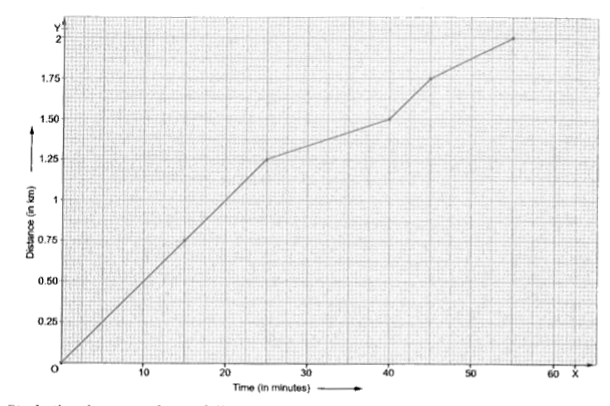
Study the above graph carefully and answer the questions given below :
(i) When does Amit make the least progress ? Explain your answer.
(ii) Find his average speed in km/hr.
The correct Answer is:(i)25 min to 40 min
Step by step video, text & image solution for The following is the distance -time graph of Amit's walking. Study the above graph carefully and answer the questions given below : (i) When does Amit make the least progress ? Explain your answer. (ii) Find his average speed in km/hr. by Maths experts to help you in doubts & scoring excellent marks in Class 8 exams.
Updated on:21/07/2023Topper's Solved these Questions
- LINE GRAPHS AND LINEAR GRAPHSBook:RS AGGARWALChapter:LINE GRAPHS AND LINEAR GRAPHSExercise:Exercise 23
Explore 25 Videos
- INTRODUCTION TO COORDINATE GEOMETRYBook:RS AGGARWALChapter:INTRODUCTION TO COORDINATE GEOMETRYExercise:EXERCISE B (OBJECTIVE QUESTIONS)
Explore 7 Videos
- LINEAR EQUATIONSBook:RS AGGARWALChapter:LINEAR EQUATIONSExercise:TEST PAPER-8 (D) (Write .T. for true and .F. for false for each of the following:)
Explore 1 Video
Similar Questions
The following is the time-distance graph of Sneha’s walking.
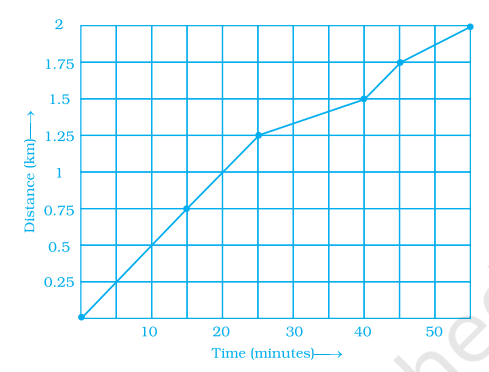
(a) When does Sneha make the least progress? Explain your reasoning.
(b) Find her average speed in km/hour.
View SolutionRead the following graph carefully and answer the questions given below:
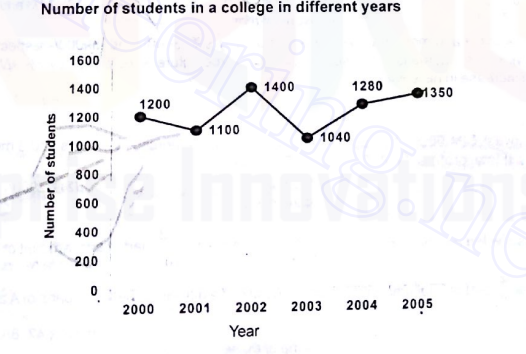
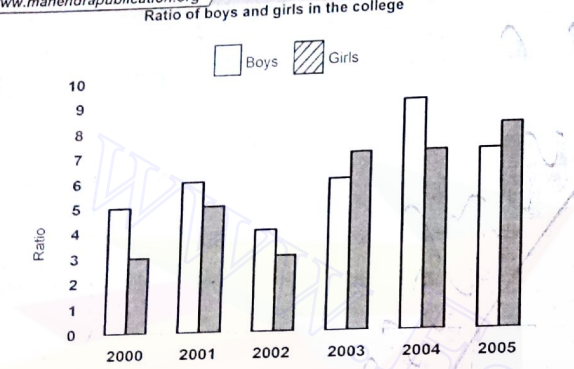
What is the average number of girls in all the years?
View Solution
Knowledge Check
Study the graph carefully and answer the following questions.
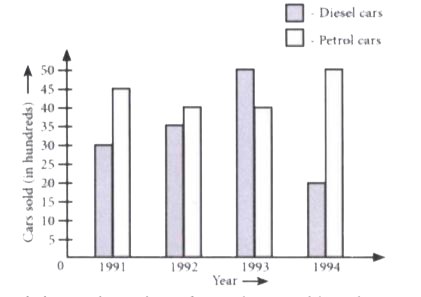
Find the mean sale of Petrol cars.A4735B5745C5740D4375Study the following graph carefully and answer the question given below-----
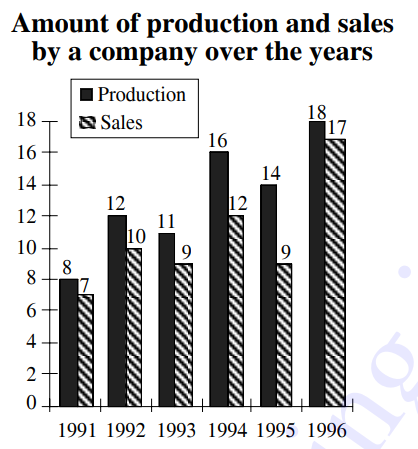
What was the difference between the sales of 1992 and 1995 ?A10 lakh tonnesB50 thousand tonnesC1 lakh tonnesD75 thousand tonnesThe following bar graph shows the games played by the students. Study the graph carefully and answer the question given below:
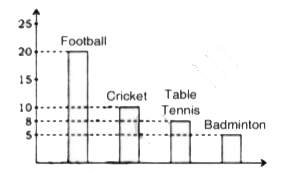
How many students play table tennis?A10B8C18D20
The following distance-time graph is for a car travelling to certain places.
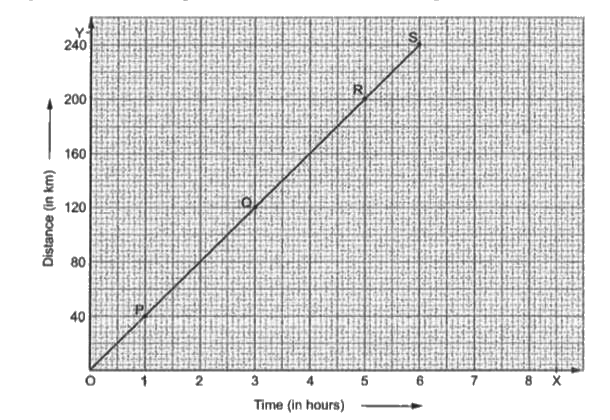
Study the above distance-time graph carefully and answer the questions given below :
(i) How far does the car travel in 412 hours ?
(ii) Hou much time does the car take to reach R ?
(iii) How long does the car take to cover 80km?
(iv) How far is Q from the starting point ?
(v) When does the car reach the place S after starting ?
View SolutionExamine the following graph carefully and answer the questions given below it :
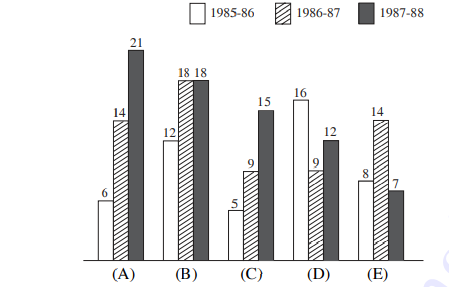
Which of the following statements is false ?
View SolutionStudy the following graph carefully and answer the questions given below it -----
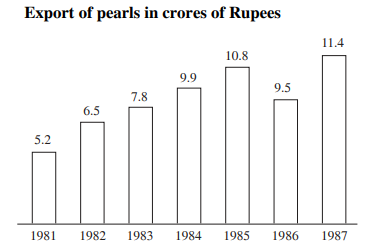
In how many years was the export above the average for the given period ?
View SolutionStudy the following graph carefully and answer the questions given below it -----
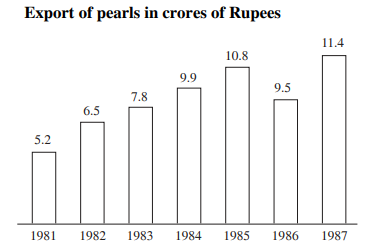
What was the percentage increase in export from 1986 to 1987 ?
View SolutionStudy the following graph carefully and answer the question given below-----
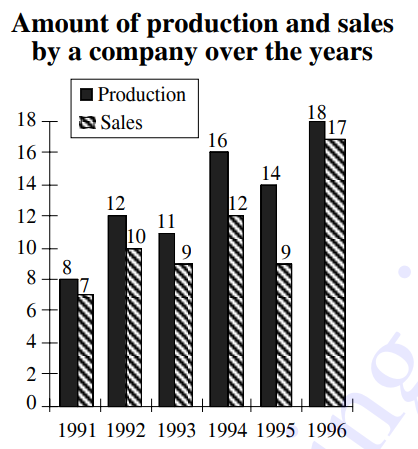
What was the percentage drop in sales from 1992 to 1993 ?
View Solution
