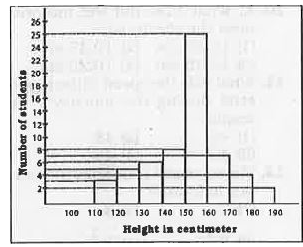
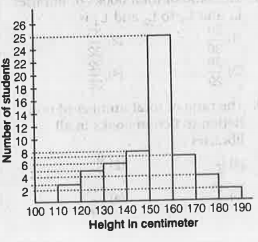
The following is the distribution of height of students of a certain class in a certain city :
Find the average height (in approx) of maximum number of students.

168.35
157.35
170.38
None of these
The correct Answer is:B
Step by step video & image solution for The following is the distribution of height of students of a certain class in a certain city : Find the average height (in approx) of maximum number of students. by Maths experts to help you in doubts & scoring excellent marks in Class 10 exams.
Updated on:21/07/2023Topper's Solved these Questions
- IMO QUESTION PAPER 2017 SET-BBOOK - SCIENCE OLYMPIAD FOUNDATION CHAPTER - IMO QUESTION PAPER 2017 SET-BEXERCISE - Everyday Mathematics
10 Videos
- IMO QUESTION PAPER 2017 SET-BBOOK - SCIENCE OLYMPIAD FOUNDATION CHAPTER - IMO QUESTION PAPER 2017 SET-BEXERCISE - Achievers Section
5 Videos
- IMO QUESTION PAPER 2017 SET-BBOOK - SCIENCE OLYMPIAD FOUNDATION CHAPTER - IMO QUESTION PAPER 2017 SET-BEXERCISE - Achievers Section
5 Videos
- IMO QUESTION PAPER 2017 SET ABOOK - SCIENCE OLYMPIAD FOUNDATION CHAPTER - IMO QUESTION PAPER 2017 SET AEXERCISE - Achievers Section
5 Videos
- IMO QUESTION PAPER 2018 SET ABOOK - SCIENCE OLYMPIAD FOUNDATION CHAPTER - IMO QUESTION PAPER 2018 SET AEXERCISE - Achievers section
5 Videos
Similar Questions
Knowledge Check
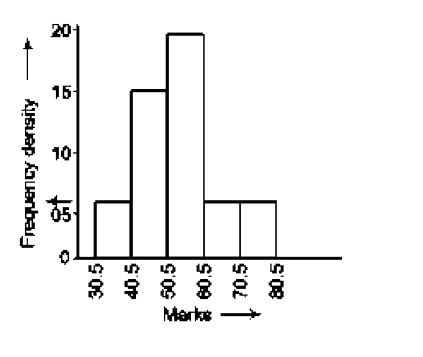
The class, in which the marks of maximum number of students lies, is
 A40.5 to 50.5B50.5 to 60.5C60.5 to 70.5D70.5 to 80.5
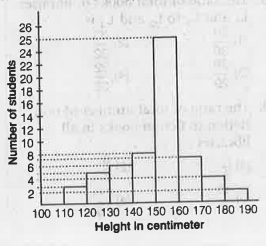
Following histogram depicts the range of heights of students in a class of 60 students. Study the same and answer the questions.

Group which contains maximum number of students isA130 - 140B150 - 160C140 - 150D160 - 170Consider the following frequency distribution of the height of 60 students of a class:
The upper limit of the median class in the given data is:
 A165B155C160D170
The following distributions represent the height of 160 studens of a class :

Find the modal height
View SolutionThe heights (in cm) of 50 students of a class are given below
Find the median height

View SolutionThe heights in centimetres of 10 students of a class are given. Find the mean
View SolutionFollowing histogram depicts the range of heights of students in a class of 60 students. Study the same and answer the questions.

Which group contains maximum number of students ?
View SolutionFollowing histogram depicts the range of heights of students in a class of 60 students. Study the same and answer the questions.

The number of students with their height between 130 cm and 140 cm, is
View Solution
