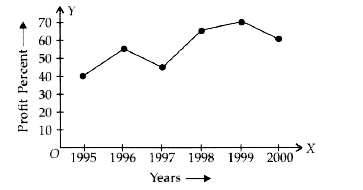
The following line-graph gives the annual profit percent earned by a Company during the period 1995-2000. Study the line-graph and answer the questions that are based on it. Profit Percent Earned by a Company Over the Years
% Profit = Income -Expenditure Expenditure ×100
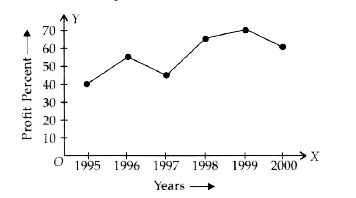
If the expenditure in 1996 and 1999 are equal, then the ratio of the incomes in 1996 to the 1999, is m: n. Find m + n.
Step by step video & image solution for The following line-graph gives the annual profit percent earned by a Company during the period 1995-2000. Study the line-graph and answer the questions that are based on it. Profit Percent Earned by a Company Over the Years % " Profit " = (" Income -Expenditure ")/(" Expenditure ") xx 100 If the expenditure in 1996 and 1999 are equal, then the ratio of the incomes in 1996 to the 1999, is m: n. Find m + n. by Maths experts to help you in doubts & scoring excellent marks in Class 8 exams.
Updated on:21/07/2023Topper's Solved these Questions
- INTRODUCTION TO GRAPHS BOOK - MTG IIT JEE FOUNDATIONCHAPTER - INTRODUCTION TO GRAPHS EXERCISE - OLYMPIAD/HOTS CORNER
5 Videos
- INTRODUCTION TO GRAPHS BOOK - MTG IIT JEE FOUNDATIONCHAPTER - INTRODUCTION TO GRAPHS EXERCISE - EXERCISE (SUBJECTIVE PROBLEMS) (LONG ANSWER TYPE)
5 Videos
- FOOTSTEPS TOWARDS JEE MAINBOOK - MTG IIT JEE FOUNDATIONCHAPTER - FOOTSTEPS TOWARDS JEE MAINEXERCISE - Section B (Numerical Value Type Questions)
9 Videos
- LINEAR EQUATIONS IN ONE VARIABLEBOOK - MTG IIT JEE FOUNDATIONCHAPTER - LINEAR EQUATIONS IN ONE VARIABLEEXERCISE - Olympiad/HOTS Corner
15 Videos
Similar Questions
The following line-graph gives the annual profit percent earned by a Company during the period 1995-2000. Study the line-graph and answer the questions that are based on it. Profit Percent Earned by a Company Over the Years
% Profit = Income -Expenditure Expenditure ×100
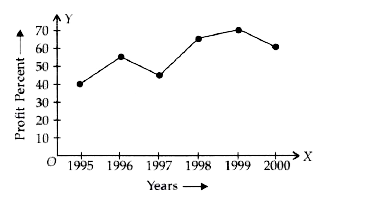
Find the difference between profit percent in 1998 and 1999.
View SolutionThe following line-graph gives the annual profit percent earned by a Company during the period 1995-2000. Study the line-graph and answer the questions that are based on it. Profit Percent Earned by a Company Over the Years
% Profit = Income -Expenditure Expenditure ×100
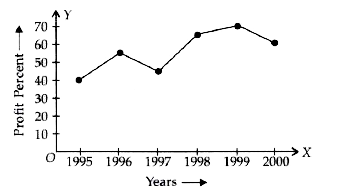
Find the average profit percent earned in given years
View Solution
Knowledge Check
The following graph represents the annual percentage profit earned by a company during the pe.riod 1996 - 2001. Study the graph carefully and answer the questions that follow .
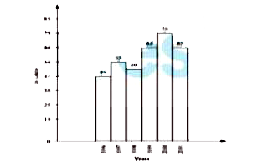
The profit earned by the company is maximum in the year:A1999B2001C1996D2000
The following line-graph gives the annual profit percent earned by a Company during the period 1995-2000. Study the line-graph and answer the questions that are based on it. Profit Percent Earned by a Company Over the Years
% Profit = Income -Expenditure Expenditure ×100
If the income in 1998 was रु 264 crores, the expenditure in 1998 is 'k crores. The ten's digit of k is
View SolutionThe following graph given the annual percent profit earned by a comppany during the period 1996-2001. Study the graph carefully and answer the questions that follow.
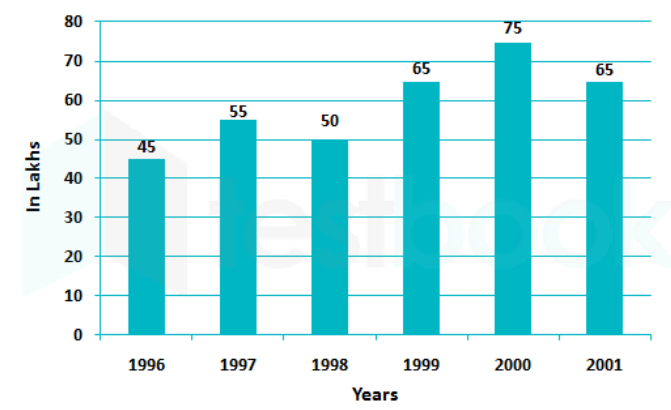
The perofit earned by the company is maximum is the year :
View SolutionThe following graph given the annual percent profit earned by a company during the period 1996-2001 . Study the graph carefully and answer the questions that follow
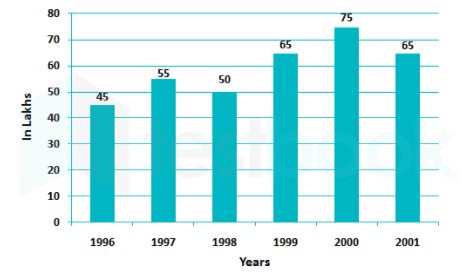
The period in which the profit of the company has increased fasted is:
View SolutionThe following graph given the annual percent profit earned by a comppany during the period 1996-2001. Study the graph carefully and answer the questions that follow.
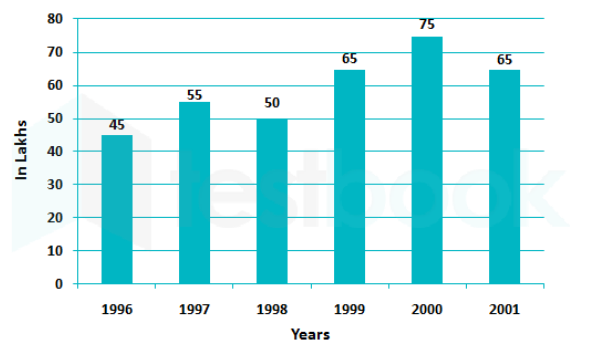
The period in which the profit of the company has increased faster is :
View SolutionThe following graph given the annual percent profit earned by a company during the period 1996-2001. Study the graph carefully and answer the questions that follow.

The expenditure of the company during the year 1996 was 30 crores. The income of the company in that year was (in crores ):
View SolutionPer cent Profit =Income-ExpenditureExpenditure×100
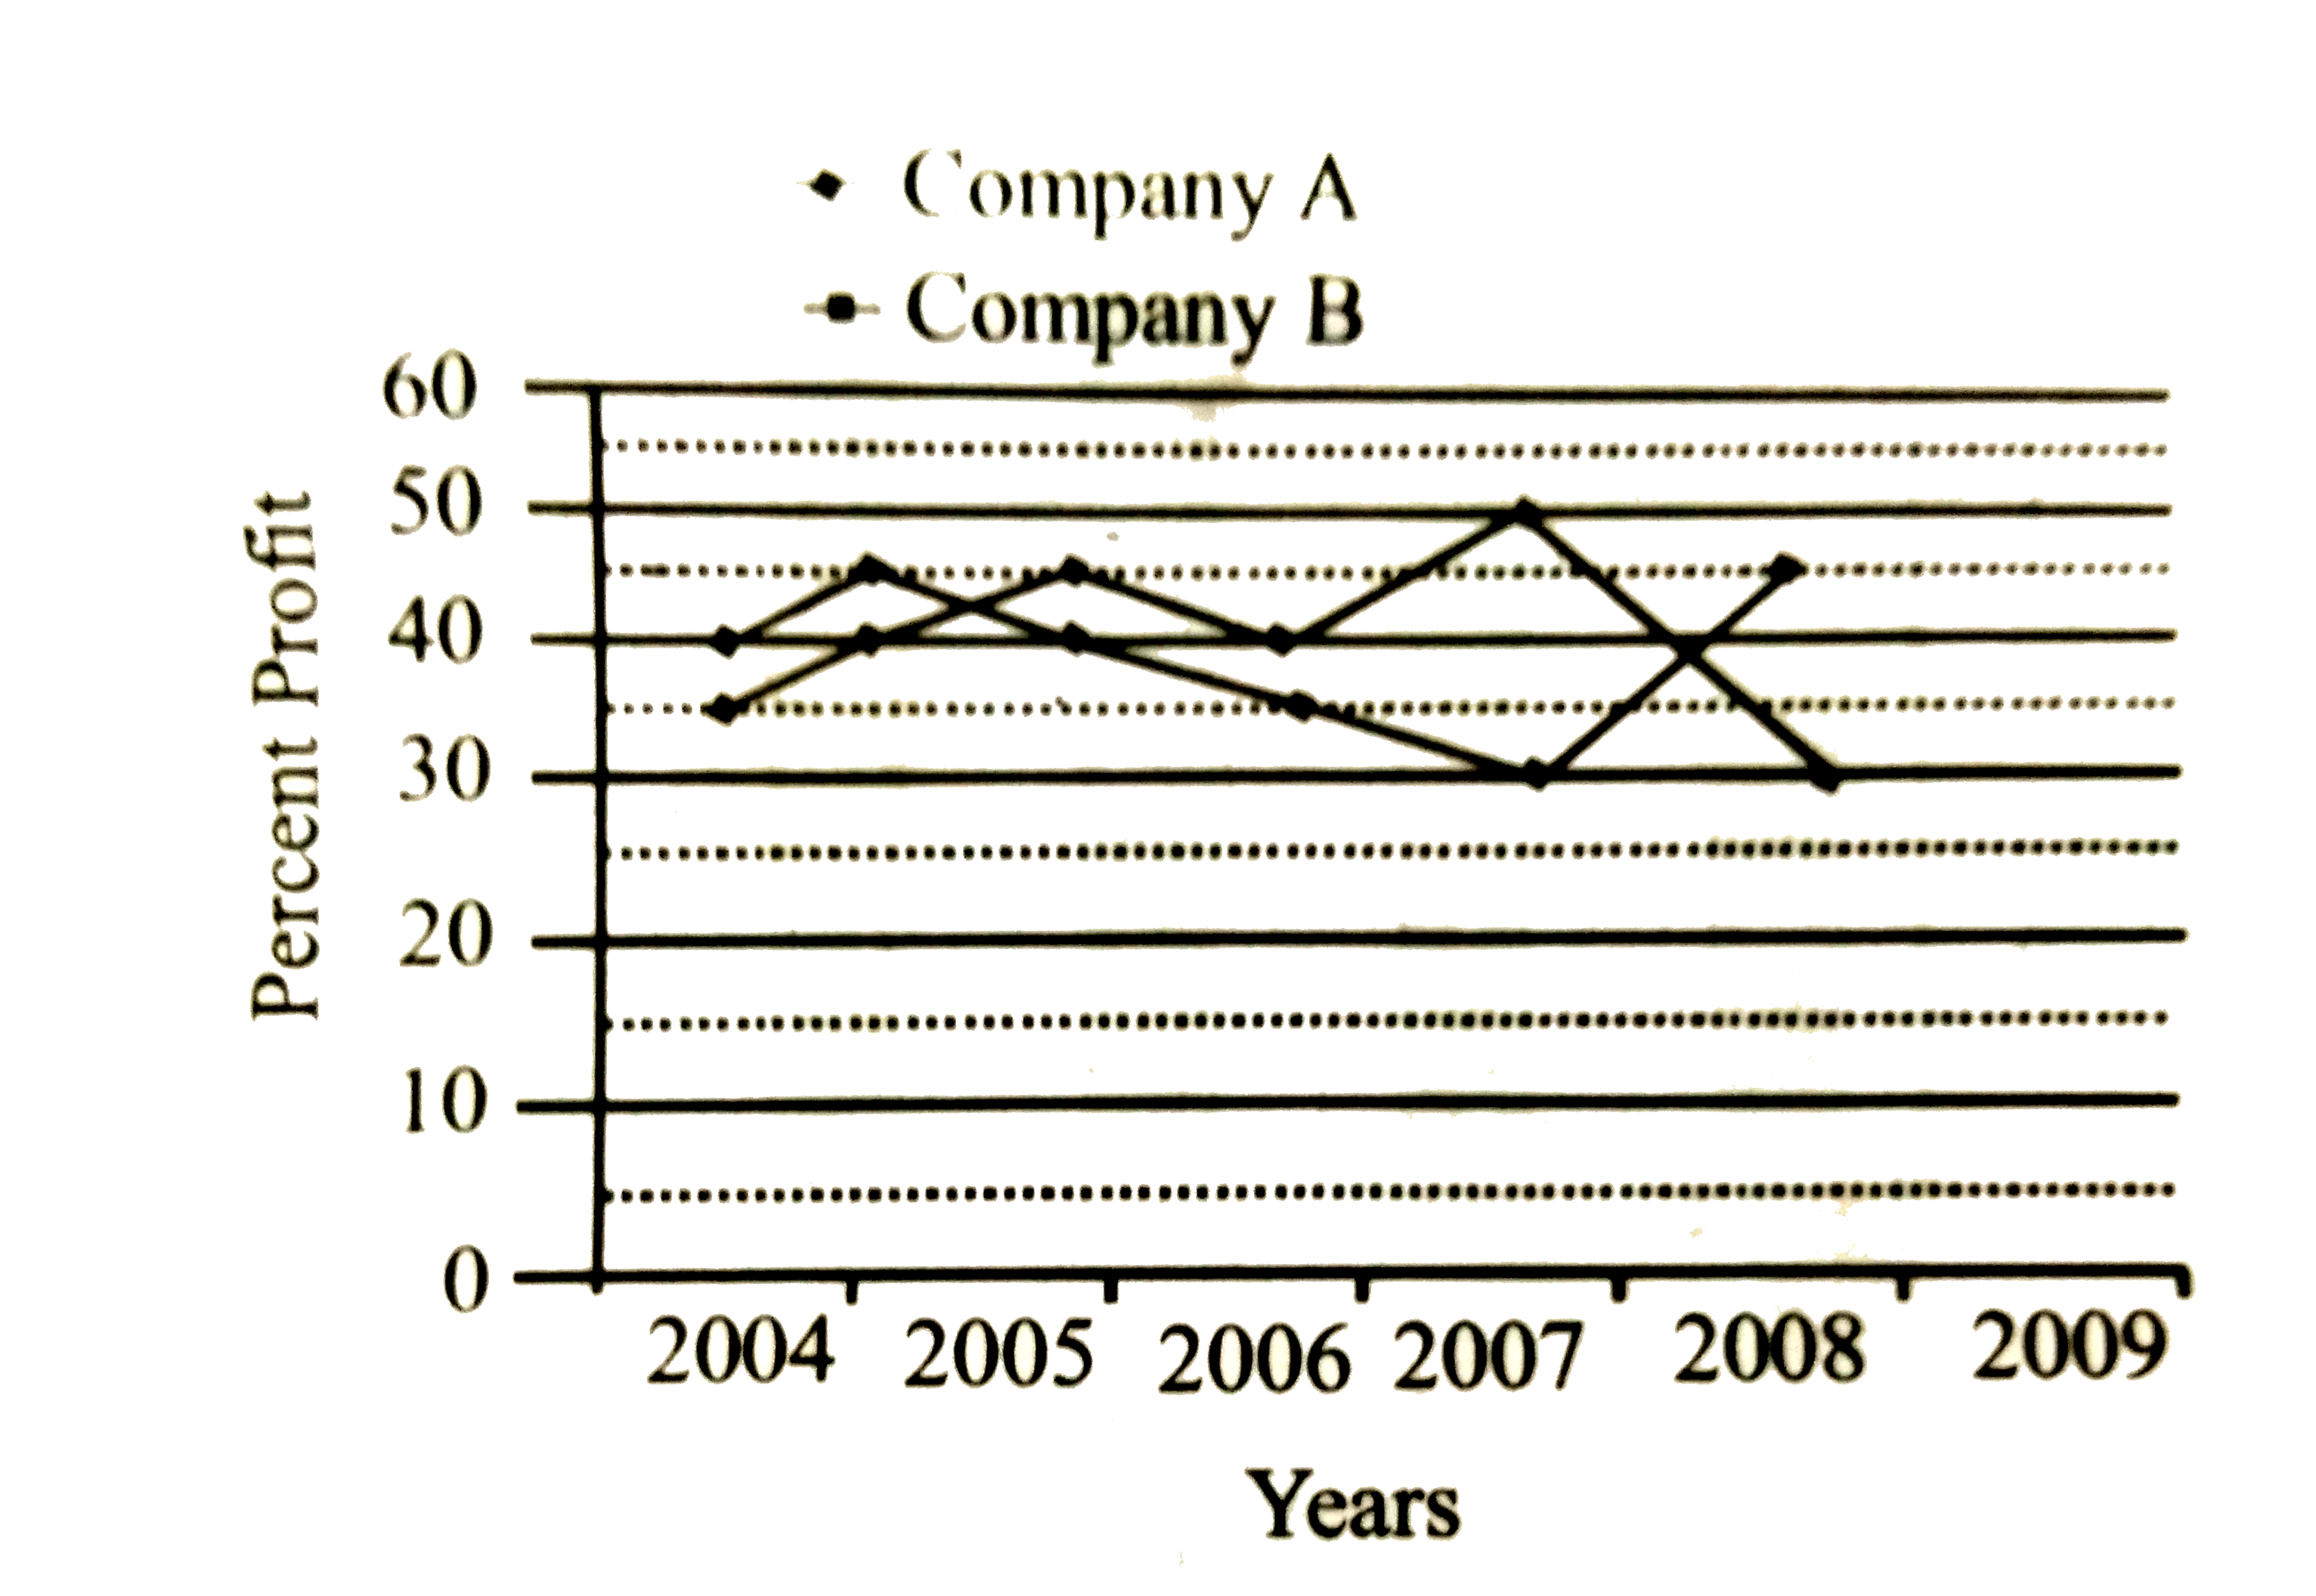
What is the average percent profit earned by Company B over all the years together?
View SolutionThe following graph given the annual percent profit earned by a company during the period 1996-2001. Study the graph carefully and answer the questions that follow.
Profit=Income - Expenditure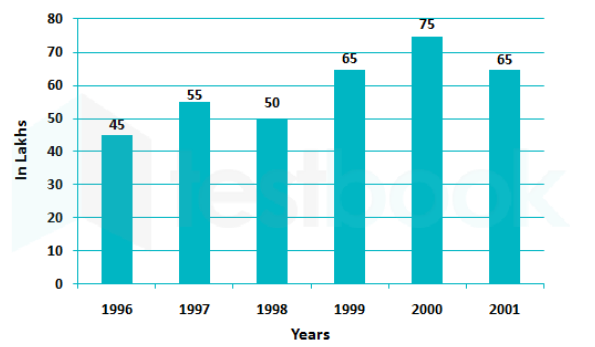
The expenditure of the company during the year 1996 was Rs 30 Lakhs. The income of the company in that year was (in Lakhs Rs):
View Solution
