The following line graph shows the change in temperature of a block of ice when heated.
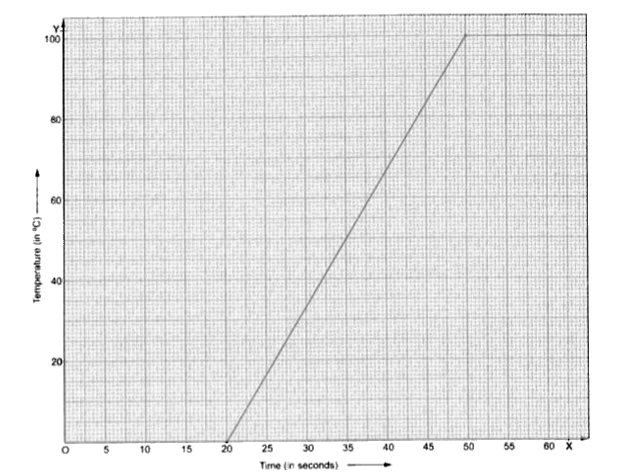
Study the above graph carefully and answer the questions given below :
(i) For how many seconds did the ice block have no change in temperature?
(ii) For how long was there a change in temperature?
(iii) After how many seconds of heating did the temperature become constant at 100∘C ?
(iv) What was the temperature after 25 seconds?
(v) What will be the temperature after 1.5 minutes ? Justify your answer.
The correct Answer is:(i)20 seconds (ii)30 seconds (iii)50 seconds (iv)18∘C (v)100∘C
Step by step video, text & image solution for The following line graph shows the change in temperature of a block of ice when heated. Study the above graph carefully and answer the questions given below : (i) For how many seconds did the ice block have no change in temperature? (ii) For how long was there a change in temperature? (iii) After how many seconds of heating did the temperature become constant at 100^(@)C ? (iv) What was the temperature after 25 seconds? (v) What will be the temperature after 1.5 minutes ? Justify your answer. by Maths experts to help you in doubts & scoring excellent marks in Class 8 exams.
Topper's Solved these Questions
- BOOK - RS AGGARWALCHAPTER - LINE GRAPHS AND LINEAR GRAPHSEXERCISE - Exercise 2325videos
LINE GRAPHS AND LINEAR GRAPHS
- BOOK - RS AGGARWALCHAPTER - INTRODUCTION TO COORDINATE GEOMETRYEXERCISE - EXERCISE B (OBJECTIVE QUESTIONS)7videos
INTRODUCTION TO COORDINATE GEOMETRY
- BOOK - RS AGGARWALCHAPTER - LINEAR EQUATIONSEXERCISE - TEST PAPER-8 (D) (Write .T. for true and .F. for false for each of the following:)1videos
LINEAR EQUATIONS
Similar Questions
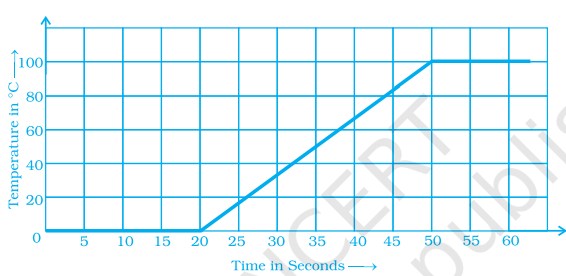
The following graph shows the change in temperature of a block of ice when heated. Use the graph to answer the following questions:
(a) For how many seconds did the ice block have no change in temperature?
(b) For how long was there a change in temperature?
(c) After how many seconds of heating did the temperature become constant at 0∘C?
(d) What was the temperature after 25 seconds?
(e) What will be the temperature after 1.5 minutes? Justify your answer.
 View Solution
How does surface tension change with temperature ?
View Solution
Knowledge Check
- Question 1 - Select One
Study the following graph carefully and answer the questions given below it -----
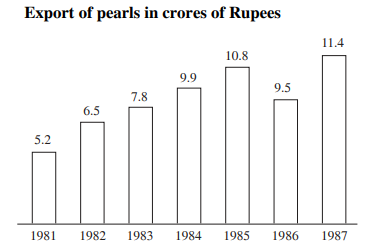
In how many years was the export above the average for the given period ?A2B3C4D5 - Question 2 - Select One
The following bar graph shows the games played by the students. Study the graph carefully and answer the question given below:

How many students play table tennis?A10B8C18D20 - Question 3 - Select One
Study the following table carefully and answer the questions given below.
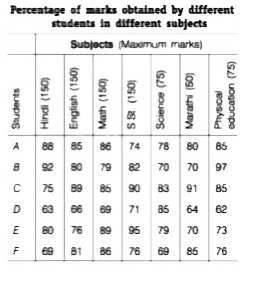
How many marks did E get in all the subjects together?A659B600C625D108
The following line graph shows the temperature forecast and the actual temperature for each day of a week.
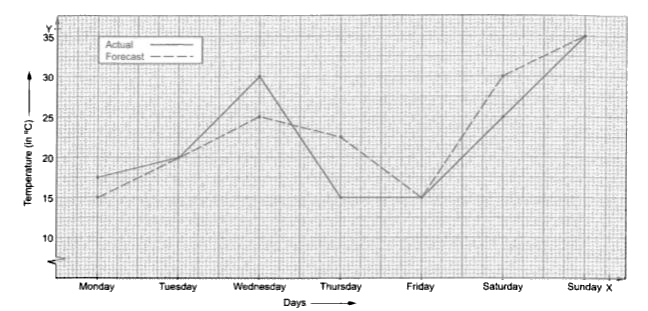
Study the above double line graph carefully and answer the questions given below:
(i) On which days was the forecast temperature the same as the actual temperature?
(ii) What was the maximum forecast temperature during the week ?
(iv) On which day did the actual temperature differ the most from the forecast temperature?View SolutionThe given figures show the change in temperature of ice when it is heated.

What is the change in temperature as ice converts to water?View SolutionThe following line graph shows the ratio of imports and exports of a company during a period of 1995-2001. Study the graph carefully and answer the questions.
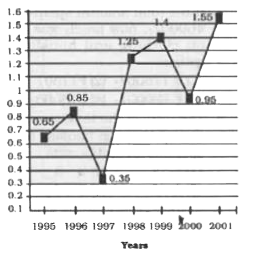
Of the given years. In how many years was the export less than import ?View SolutionStudy the following graph carefully and answer the questions that
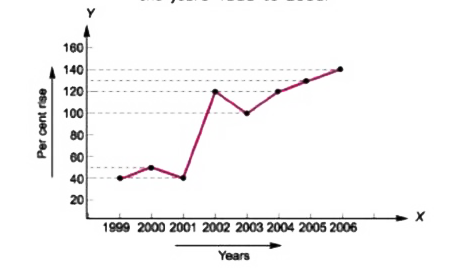
For how many years , the percent rise was more than 100 % ?View SolutionStudy the graph carefully and answer the following questions.
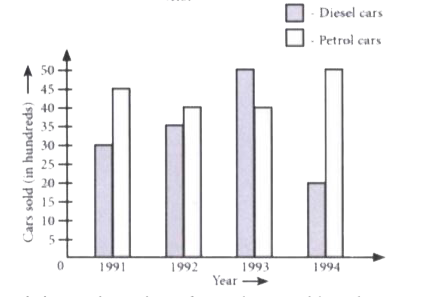
How many cars were sold during the year 1991?View Solution

