The following pie diagram represents the number of valid votes obtained by four students who contested for school captain . The total of valid votes polled was 720 . Answer the following questions.
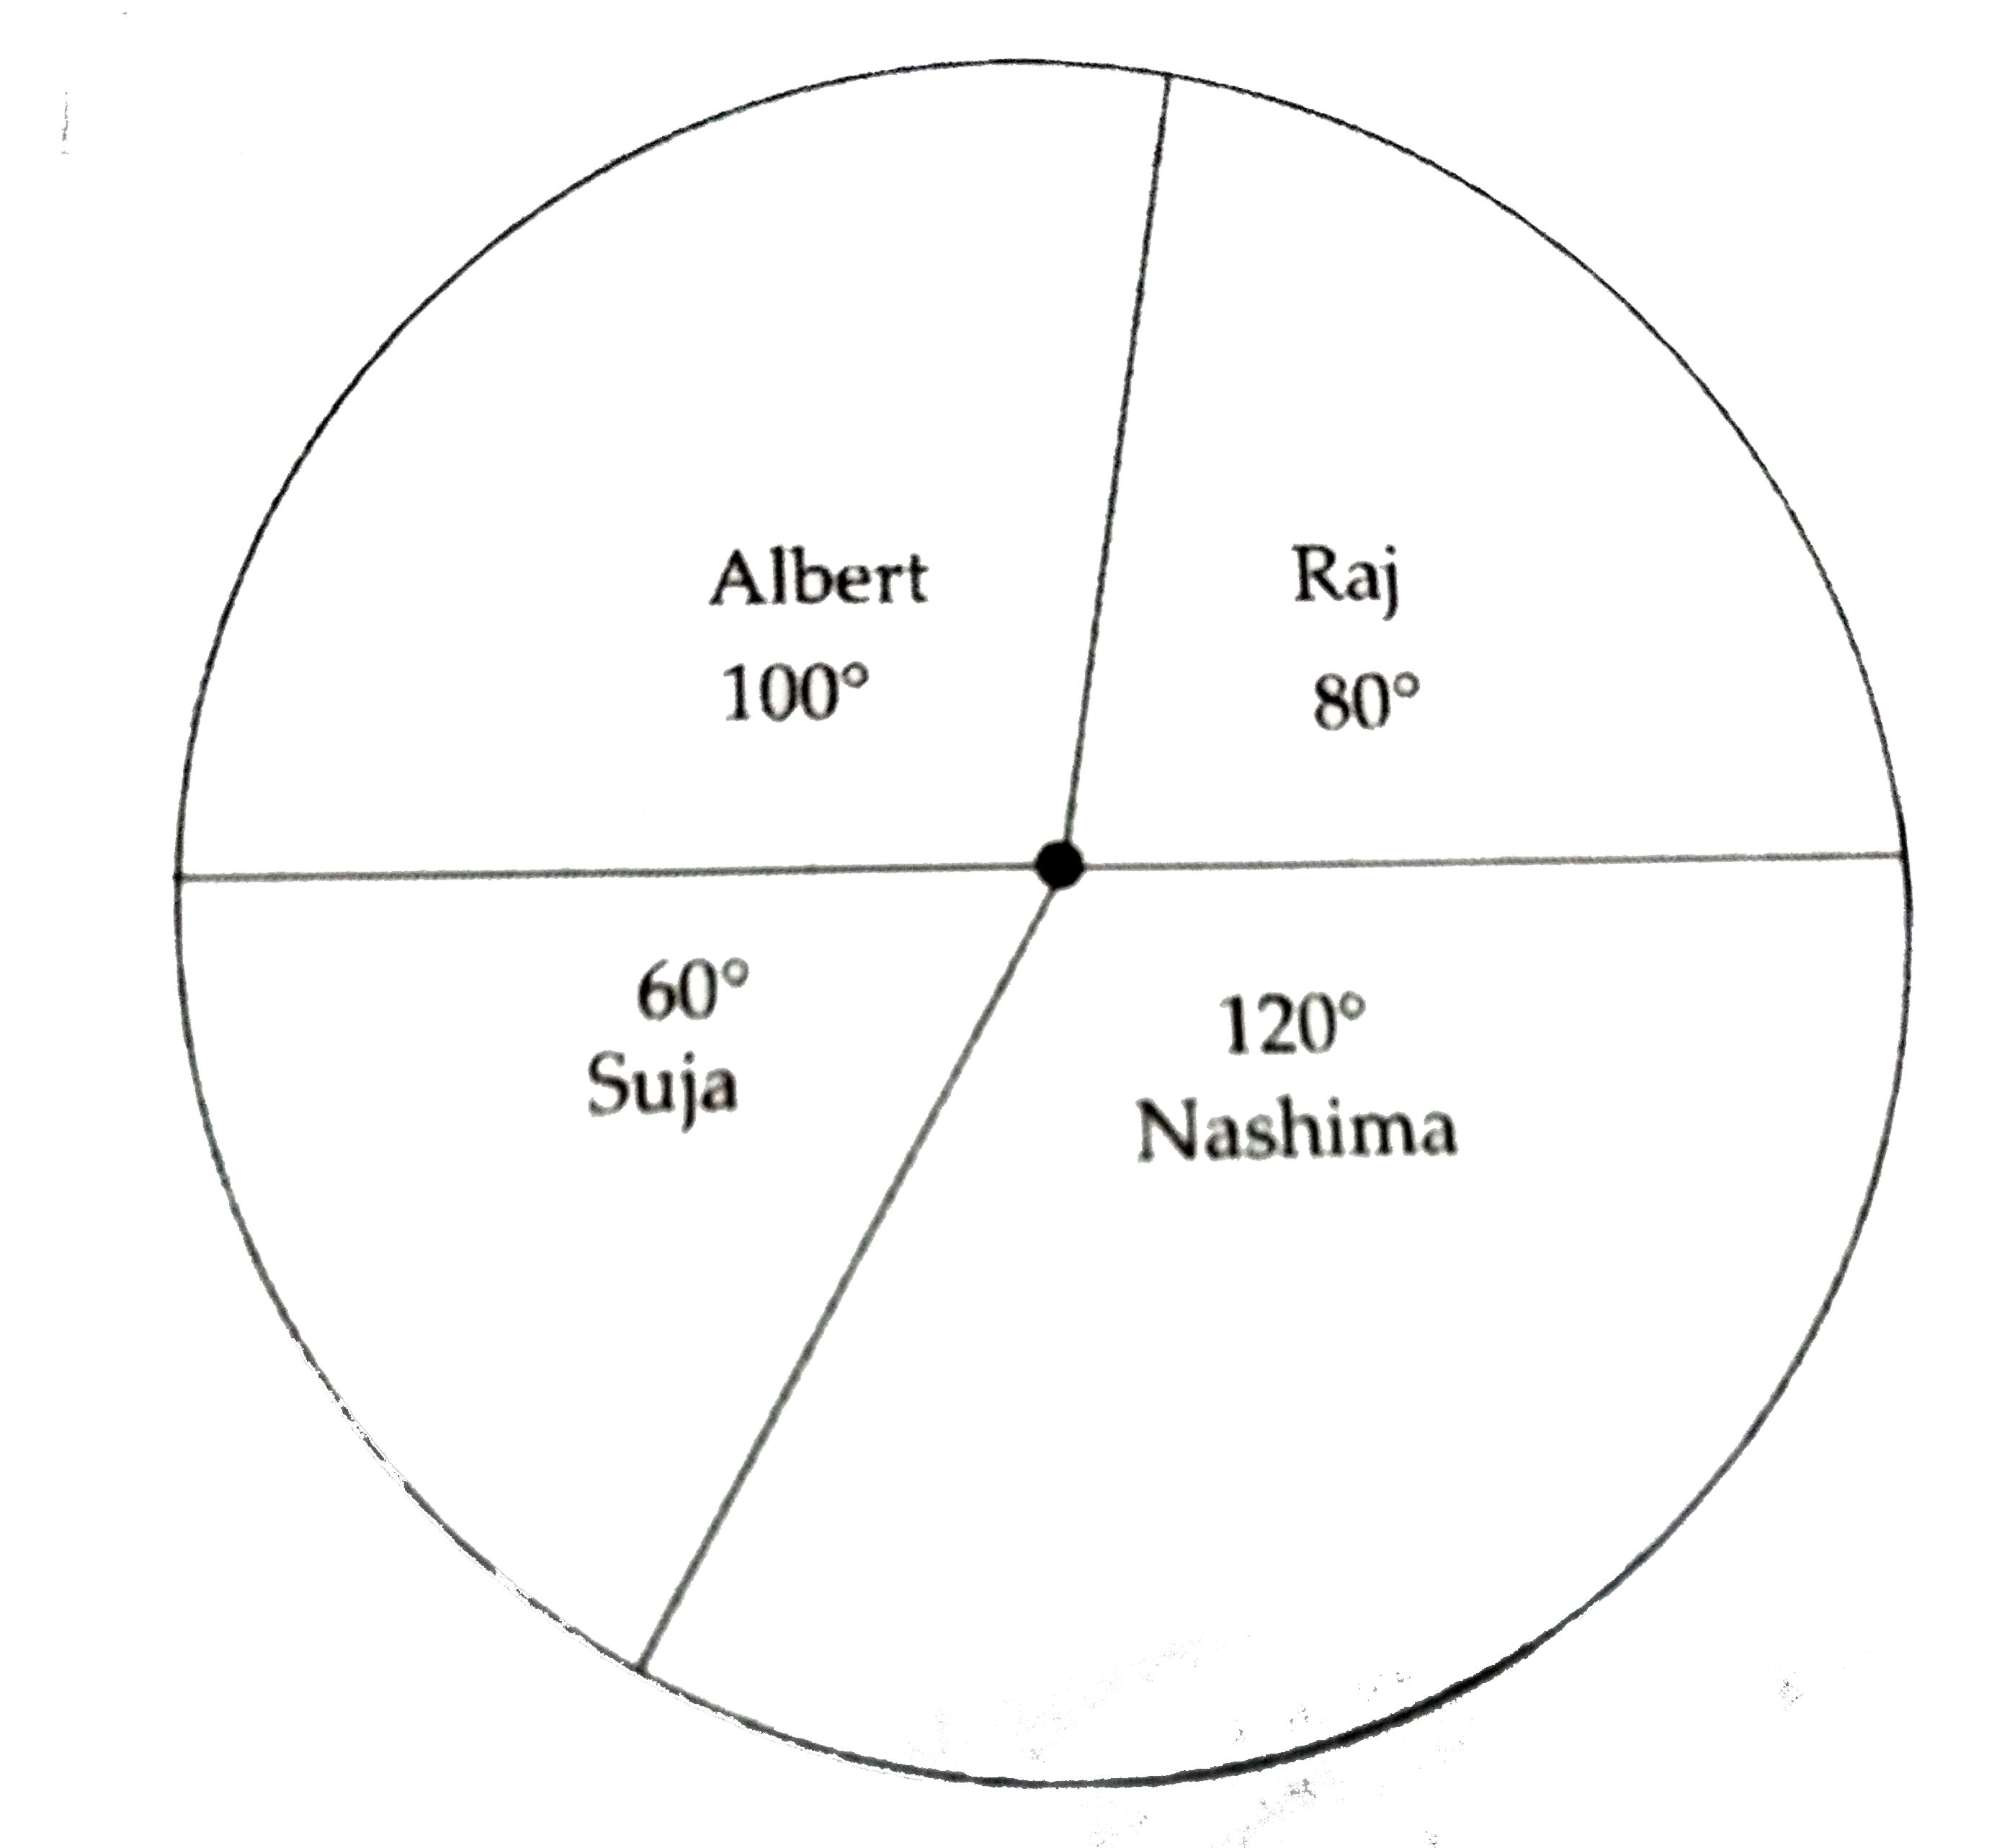
Who has won the election ? Solution in Tamil
The correct Answer is:Nashima
Step by step video & image solution for The following pie diagram represents the number of valid votes obtained by four students who contested for school captain . The total of valid votes polled was 720 . Answer the following questions. Who has won the election ? by Maths experts to help you in doubts & scoring excellent marks in Class 10 exams.
Updated on:21/07/2023Topper's Solved these Questions
- STATISTICS BOOK - CHETAN PUBLICATIONCHAPTER - STATISTICS EXERCISE - ASSIGNMENT -6
12 Videos
- STATISTICS BOOK - CHETAN PUBLICATIONCHAPTER - STATISTICS EXERCISE - PRACTICE SET -6.6
11 Videos
- STANDARD IX SYLLABUS BOOK - CHETAN PUBLICATIONCHAPTER - STANDARD IX SYLLABUS EXERCISE - PROBLEMS FOR PRACTICE
20 Videos
- TRIGONOMETRYBOOK - CHETAN PUBLICATIONCHAPTER - TRIGONOMETRYEXERCISE - ASSIGNMENT - 6
11 Videos
Similar Questions
Choose the correct alternative among the following :
The class mark of the class interval 120-130 is,
View SolutionThe age group and number of persons , who donated blood in a blood donation camp is given below . Draw a pie diagram from it .

View SolutionDraw segment PQ=4.3cm and bisect it.
View SolutionIf sinθ=45, then find cosθ
View SolutionMatch the following Column A to Column B

View SolutionMatch the following Column A to Column B

View SolutionThe inequation represented by the graph given below is :
View SolutionThe inequation that best describes the following graph is _________
View SolutionThe pie diagram represents the number of valid votes secured by four students who contested for school captain.The total number of valid votes polled was 720.
Answer the following questions :
(i) Who has won the election ?
(ii) How many votes died the winner secure ?
(iii) What is the minimum number of votes ?Who got it ?
(iv) By how many votes did the winner defeat the nearest contestant ?
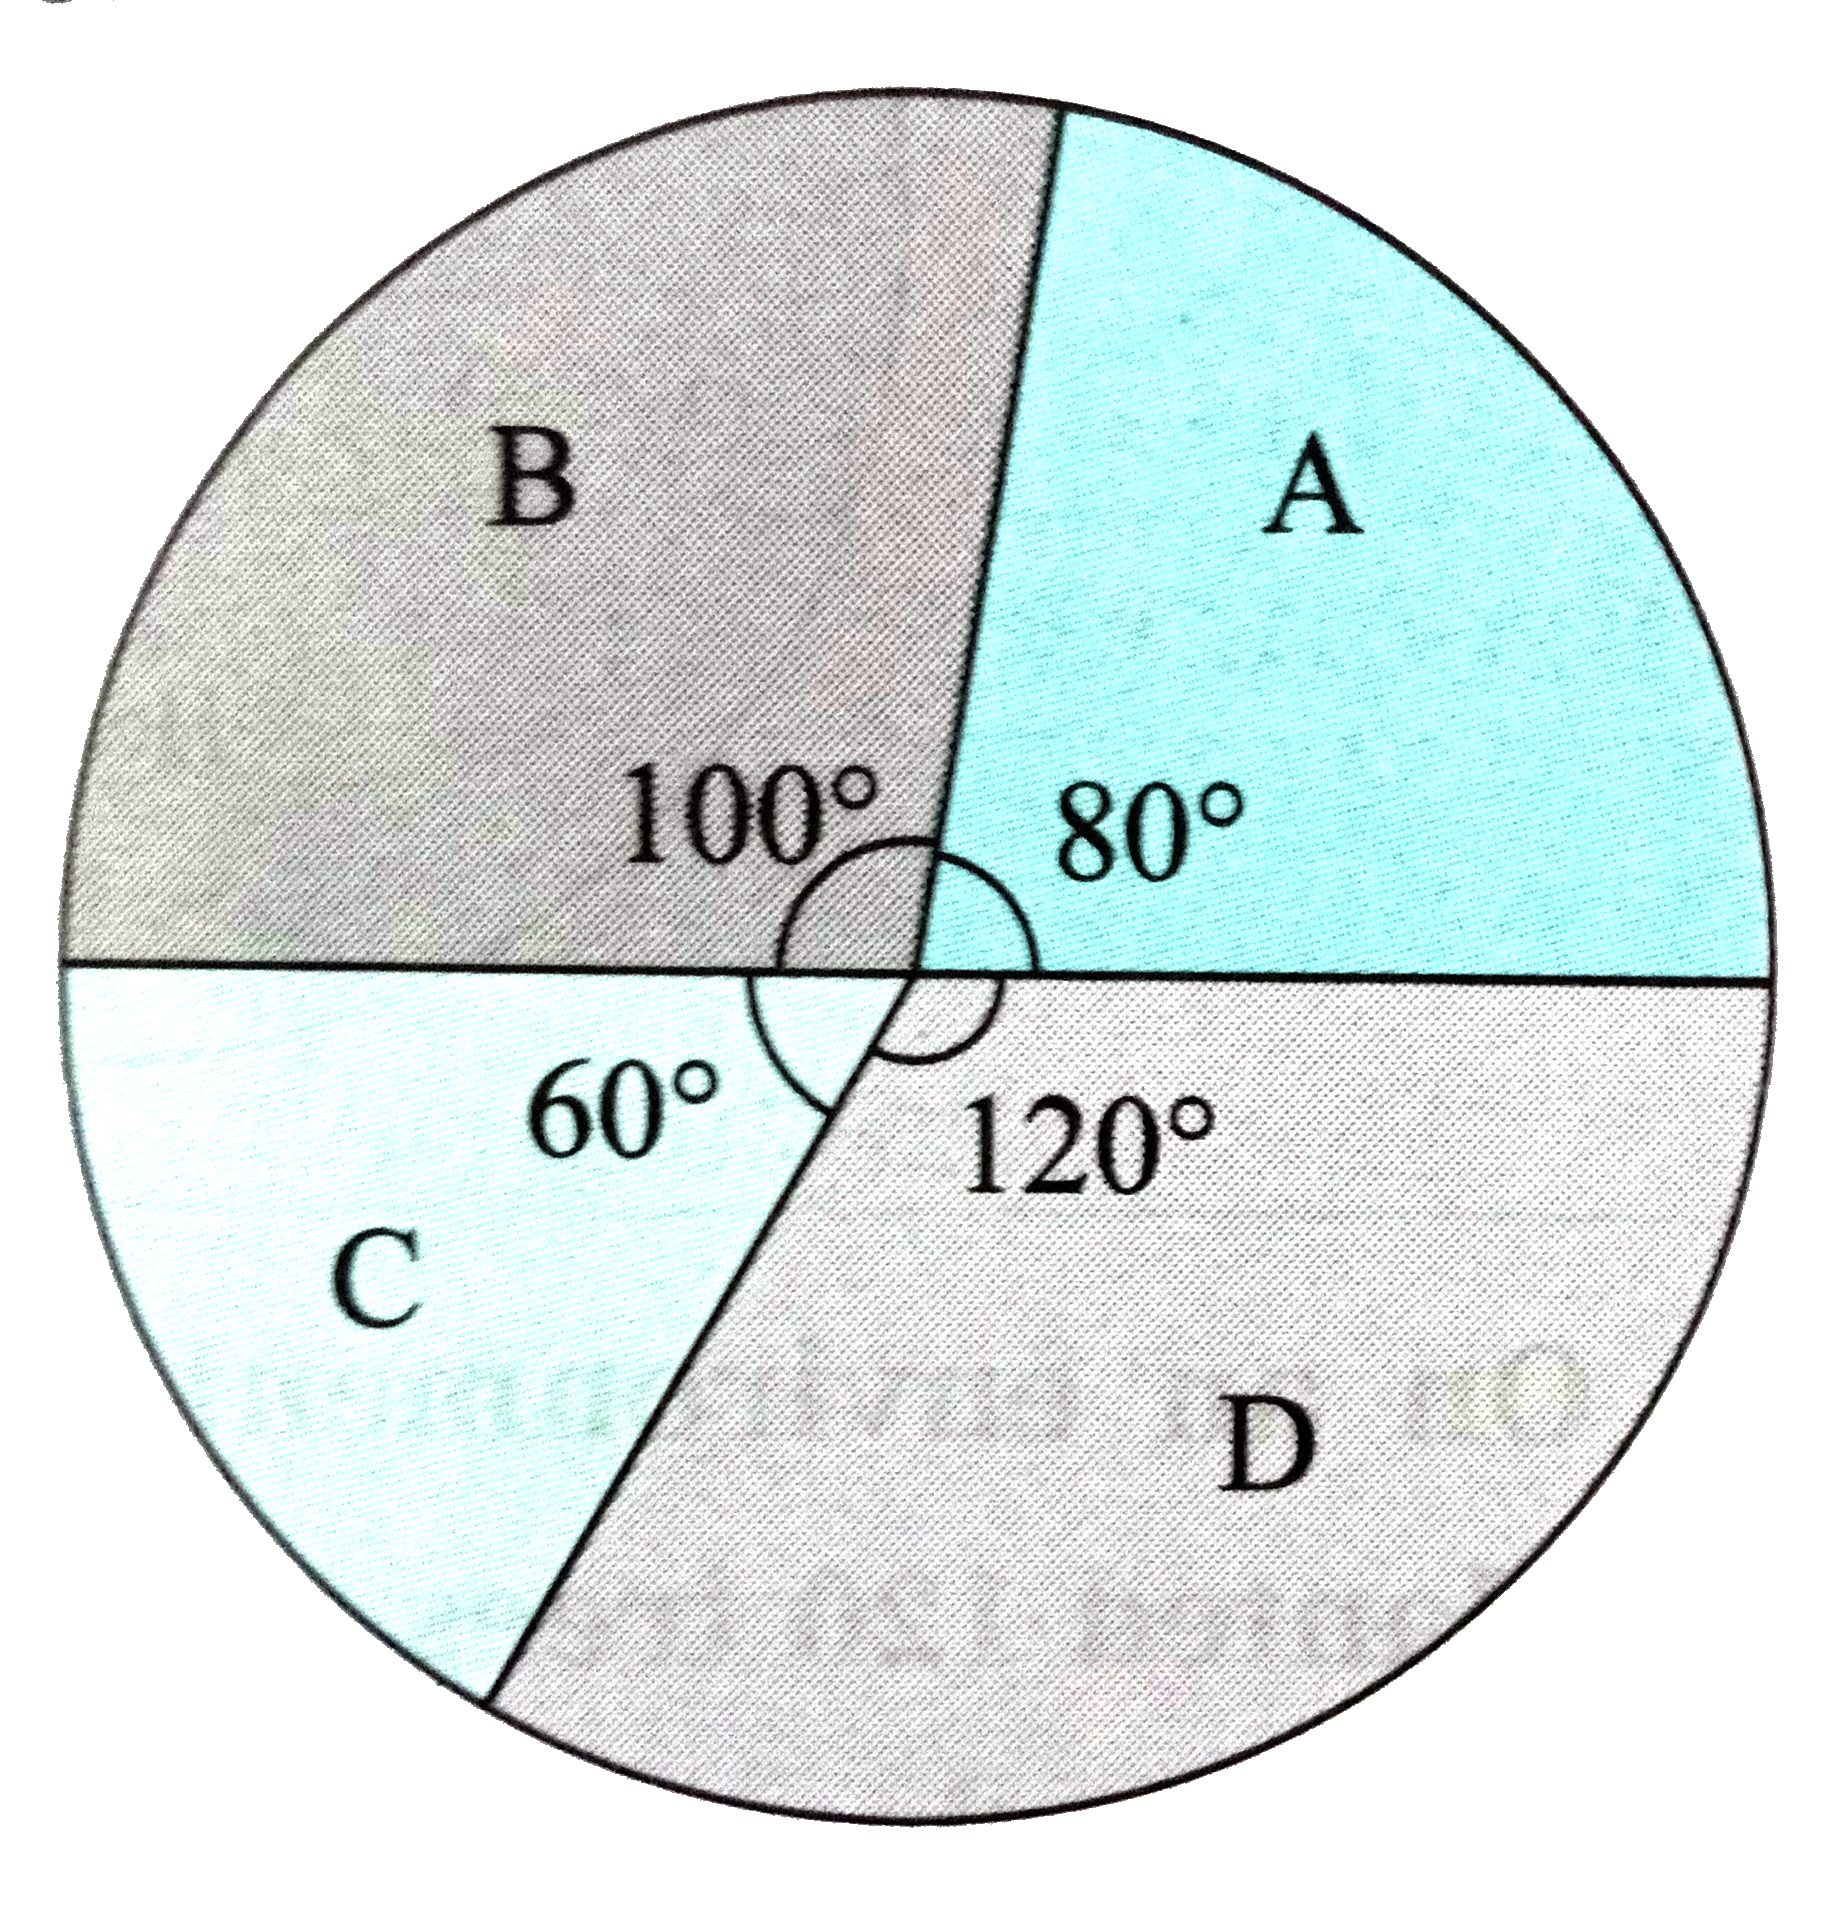
View SolutionThe following pie diagram represents the number of valid votes obtained by four students who contested for school captain . The total of valid votes polled was 720 . Answer the following questions.
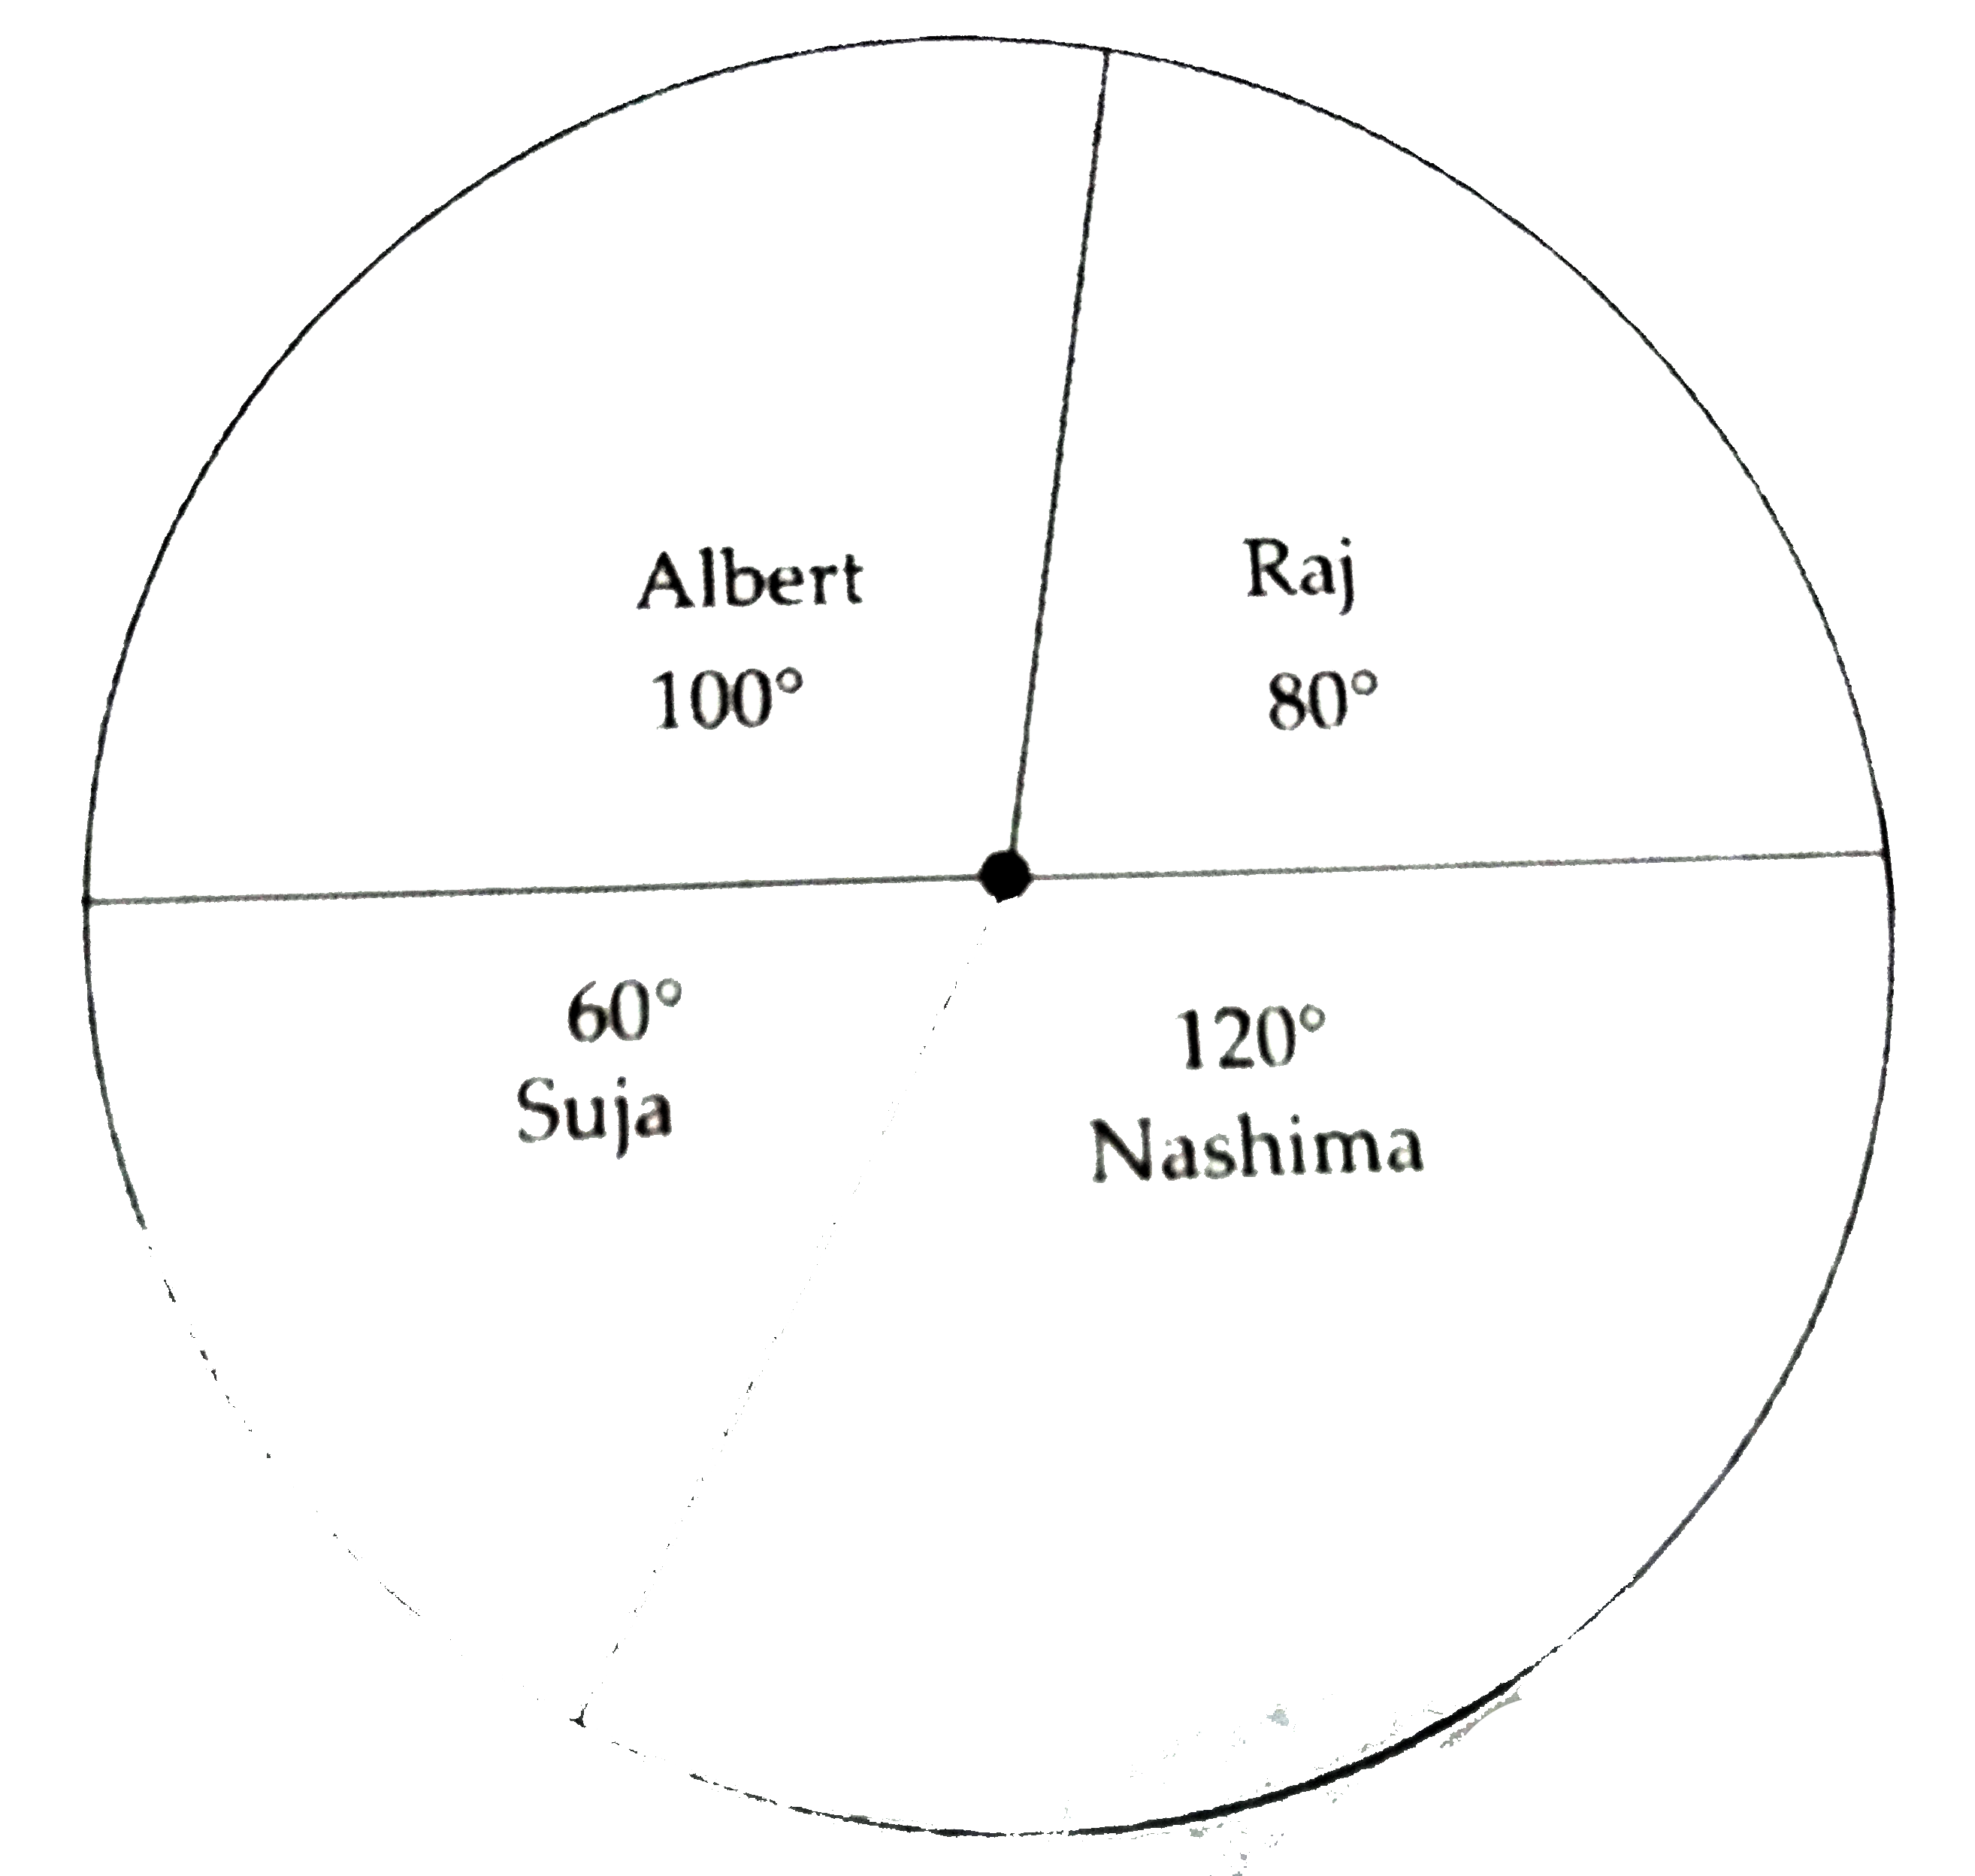
What is the minimum no. of votes ? Who got it ?
View SolutionThe following pie diagram represents the number of valid votes obtained by four students who contested for school captain . The total of valid votes polled was 720 . Answer the following questions.
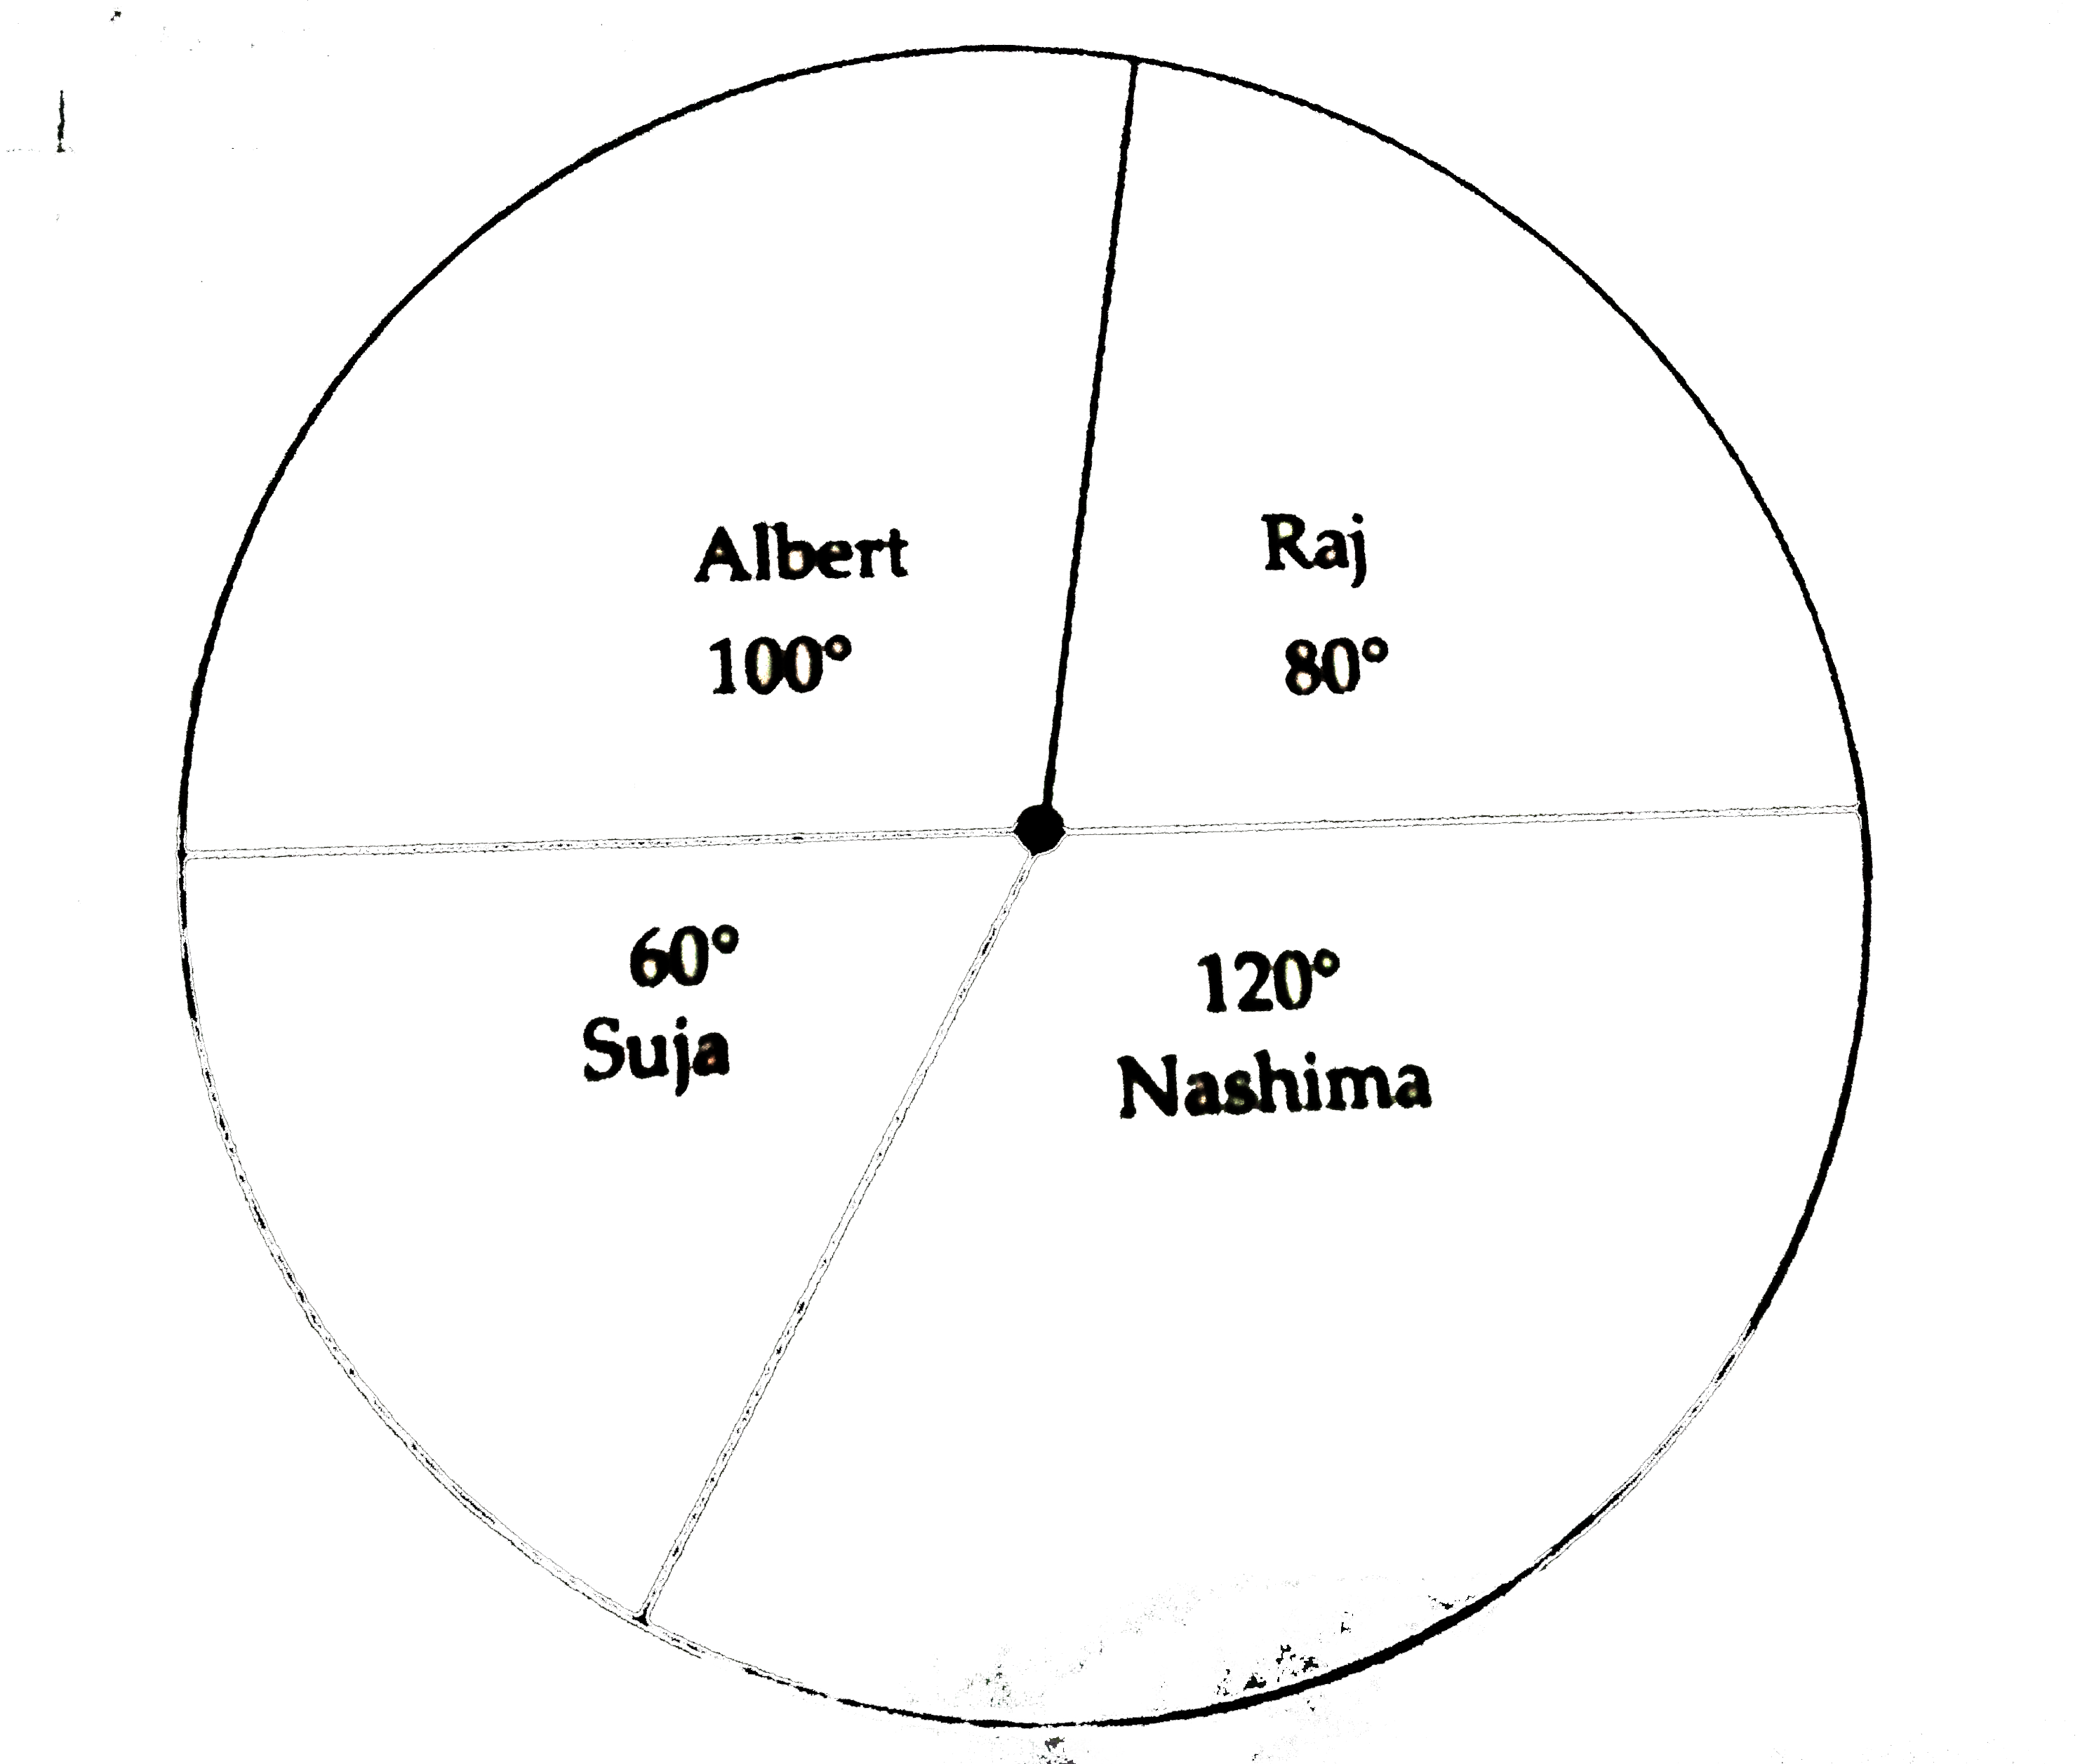
By how many votes did the winner defeat the nearest contestant ?
View SolutionThe pie chart, given here, represents the number of valid votes obtained by four students who contested election for school leadership. The total number of valid votes polled was 720.
Observe the chart and answer the questions based on it.
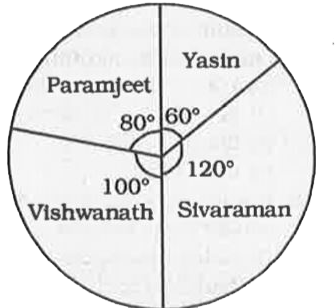
What was the minimum number of votes obtained by any candidate?
View SolutionThe pie chart, given here, represents the number of valid votes obtained by four students who contested election for school leadership. The total number of valid votes polled was 720.
Observe the chart and answer the questions based on it.
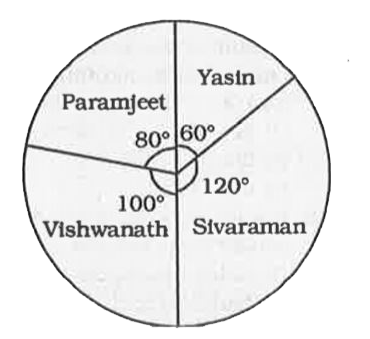
What was the winner ?
View SolutionThe pie chart, given here, represents the number of valid votes obtained by four students who contested election for school leadership. The total number of valid votes polled was 720.
Observe the chart and answer the questions based on it.
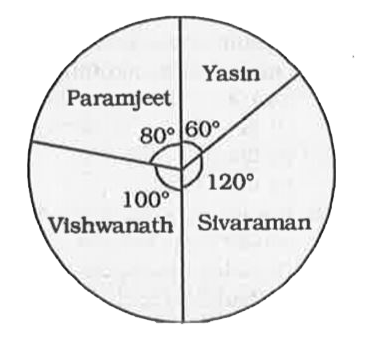
By how many votes did the winner defeat his nearest rival ?
View SolutionThe following pie-chart represents the total number of valid votes obtained by four students who contested for school leadership. The total number of valid votes polled was 720. Answer the following questions by reading the pie-chart.
View Solution
