The following table gives the distribution of total household expenditure (in Rs) of mannual workers in a city. Find the mean expenditure (in Rs) per household by using on approximate method.
 What does mean signify?Solution in Punjabi
Step by step video & image solution for The following table gives the distribution of total household expenditure (in Rs) of mannual workers in a city. Find the mean expenditure (in Rs) per household by using on approximate method. What does mean signify? by Maths experts to help you in doubts & scoring excellent marks in Class 10 exams.
Topper's Solved these Questions
Similar Questions
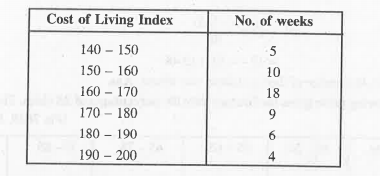
In a city, the following weekly observations were made in a study of cost of living index for the year 1980-81.
 Calculate the mean weekly cost of living index by a suitable method.View Solution
An aeroplane, when 3000 m high, passes vertically above another aeroplane at an instant when the angles of elevation of the two aeroplanes from the same point on the ground are 60∘ and 45∘ respectively. Find the vertical distance between the two aeroplanes.
01:37View SolutionA toy is in the form of a cone mounted on a hemisphere of radius 3.5 cm. The total height of the toy is 15.5 cm. Find the surface area of the toy
06:07View SolutionThe following data gives the distribution of total household expendilture ( in Rs.) of workers is a city :

Find the average expenditure which is being done by maximum number of manual workers.02:11View SolutionHow many lines of symmetry does the above figure have ?
01:31View SolutionWhich of the following are correct chain isomers of butane ? (i)
02:45View SolutionDetermine the point of symmetry of a regular hexagon.
02:17View SolutionDtermine the images of the following figure about the given line :
05:41View SolutionMatch the following Column A to Column B
 02:21View Solution
Match the following Column A to Column B
 02:10View Solution
Match the following Column A to Column B
 02:17View Solution
Find the area of the figure given below.
 02:10View Solution
The inequation represented by the graph given below is :
01:13View SolutionThe inequation that best describes the graph given below is _________
04:38View SolutionThe inequation that best describes the following graph is _________
01:52View Solution

