The following table gives the life-time (in days) of 100 electric bulbs of a certain brand

From this table, construct the frequency distribution table
The correct Answer is:NA
Step by step video & image solution for The following table gives the life-time (in days) of 100 electric bulbs of a certain brand From this table, construct the frequency distribution table by Maths experts to help you in doubts & scoring excellent marks in Class 10 exams.
Updated on:21/07/2023Topper's Solved these Questions
- MEAN,MEDAN,MODE OF GROUPED,DATA CUMULATIVE FREQUENCY GRAPH AND OGIVE BOOK - RS AGGARWALCHAPTER - MEAN,MEDAN,MODE OF GROUPED,DATA CUMULATIVE FREQUENCY GRAPH AND OGIVE EXERCISE - Exercise 18F
9 Videos
- MEAN,MEDAN,MODE OF GROUPED,DATA CUMULATIVE FREQUENCY GRAPH AND OGIVE BOOK - RS AGGARWALCHAPTER - MEAN,MEDAN,MODE OF GROUPED,DATA CUMULATIVE FREQUENCY GRAPH AND OGIVE EXERCISE - Multiple Choice Questions (Mcq)
23 Videos
- MEAN,MEDAN,MODE OF GROUPED,DATA CUMULATIVE FREQUENCY GRAPH AND OGIVE BOOK - RS AGGARWALCHAPTER - MEAN,MEDAN,MODE OF GROUPED,DATA CUMULATIVE FREQUENCY GRAPH AND OGIVE EXERCISE - EXERCISE 18 E
10 Videos
- LINEAR EQUATIONS IN TWO VARIABLES BOOK - RS AGGARWALCHAPTER - LINEAR EQUATIONS IN TWO VARIABLES EXERCISE - QUESTION
2 Videos
- PERIMETER AND AREA OF PLANE FIGURES BOOK - RS AGGARWALCHAPTER - PERIMETER AND AREA OF PLANE FIGURES EXERCISE - TEST YOURSELF (SHORT -ANSWER QUESTIONS)
1 Videos
Similar Questions
The following table show tha cumulative frequency distribution of marks of 800 students in an examination.
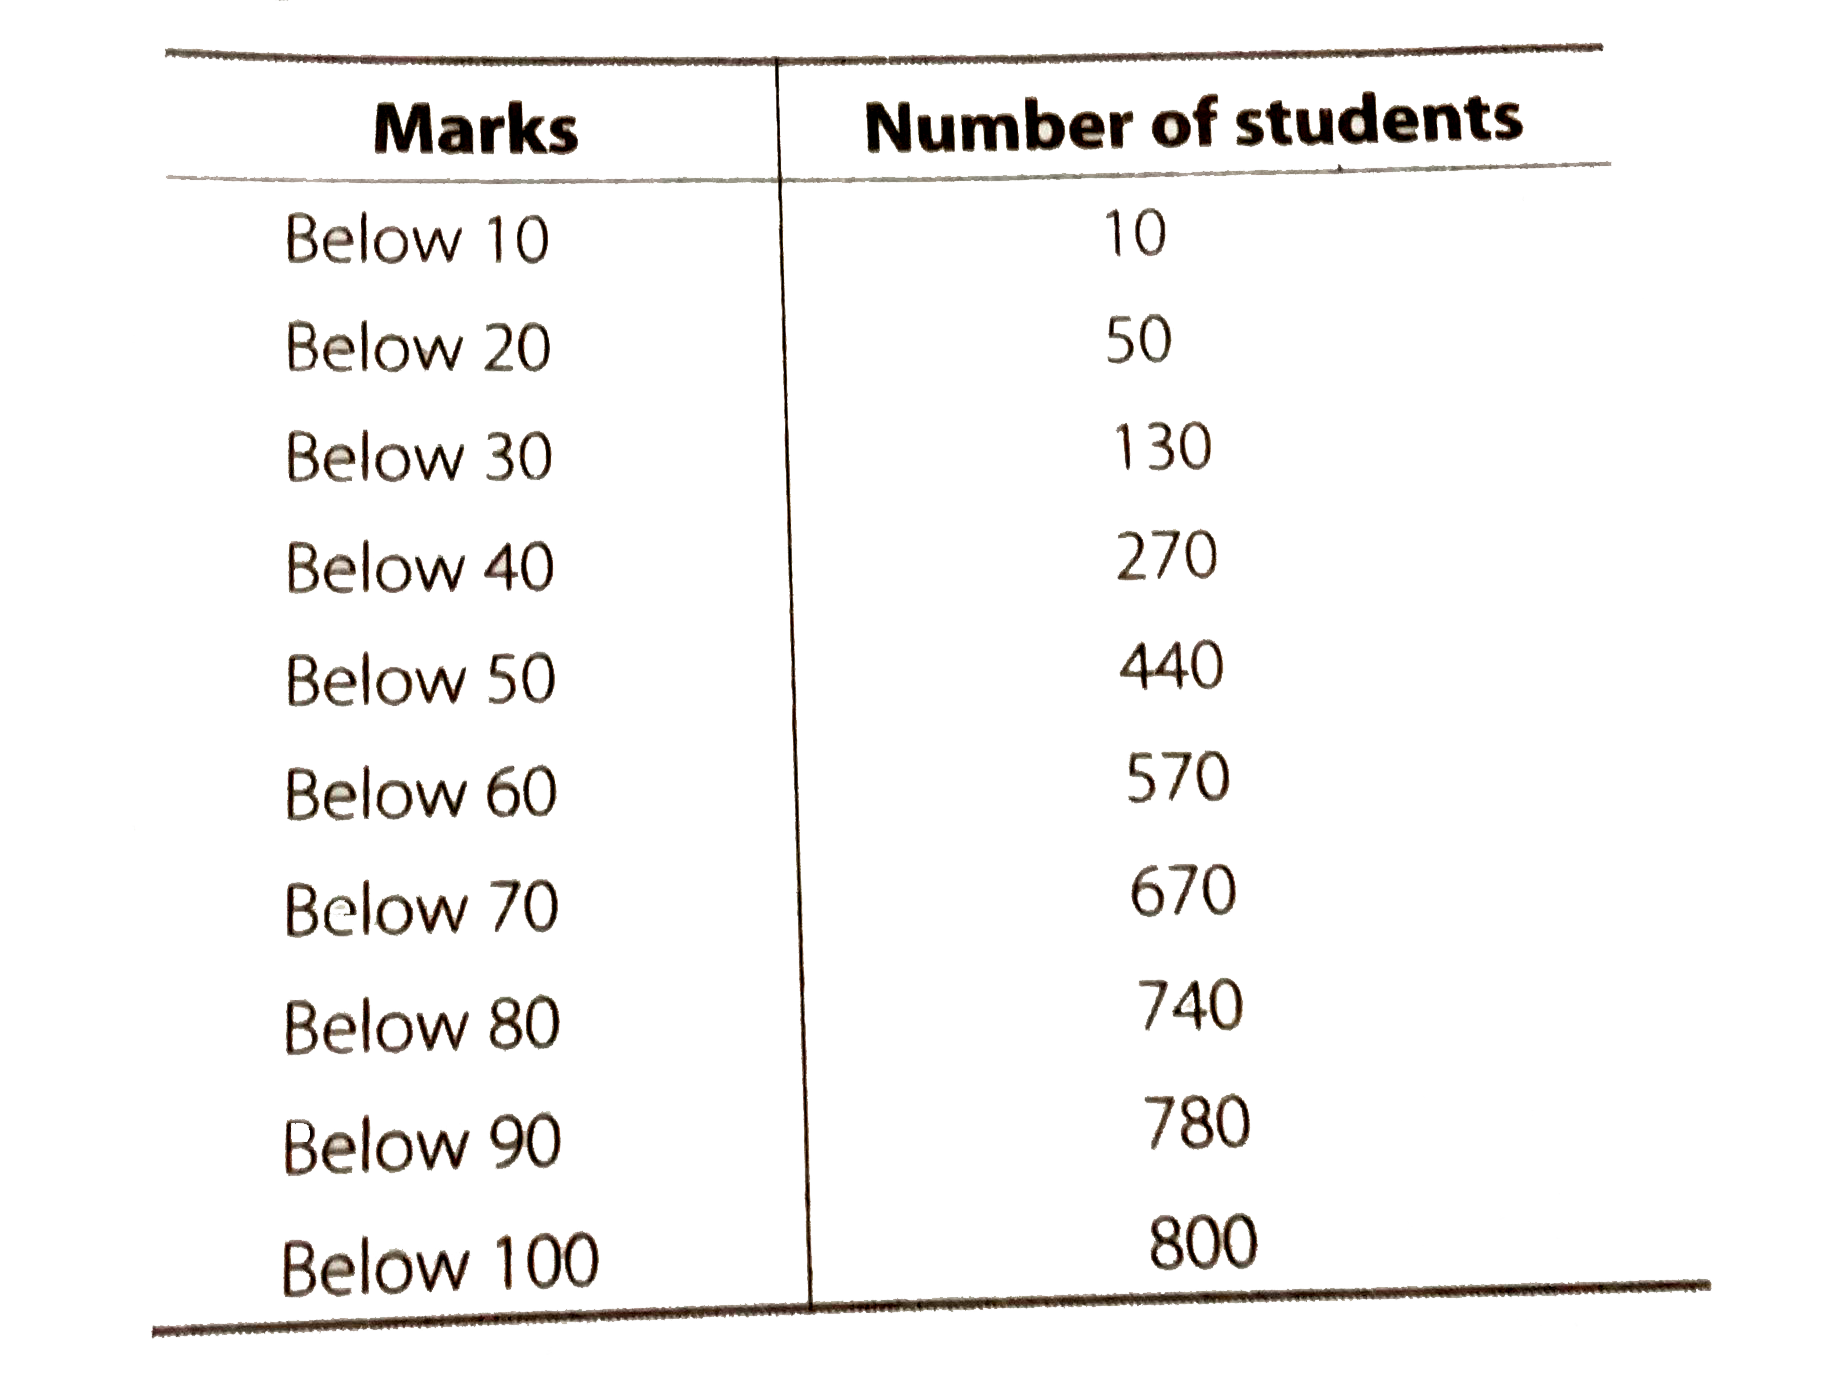
Construct a frequency distribution table for the data above.
View SolutionThe following table gives the continous frequency distribution of a continous variable x

What is the mean of the abuve frequency distribution?
View SolutionFrom the frequency distribution table from the following data
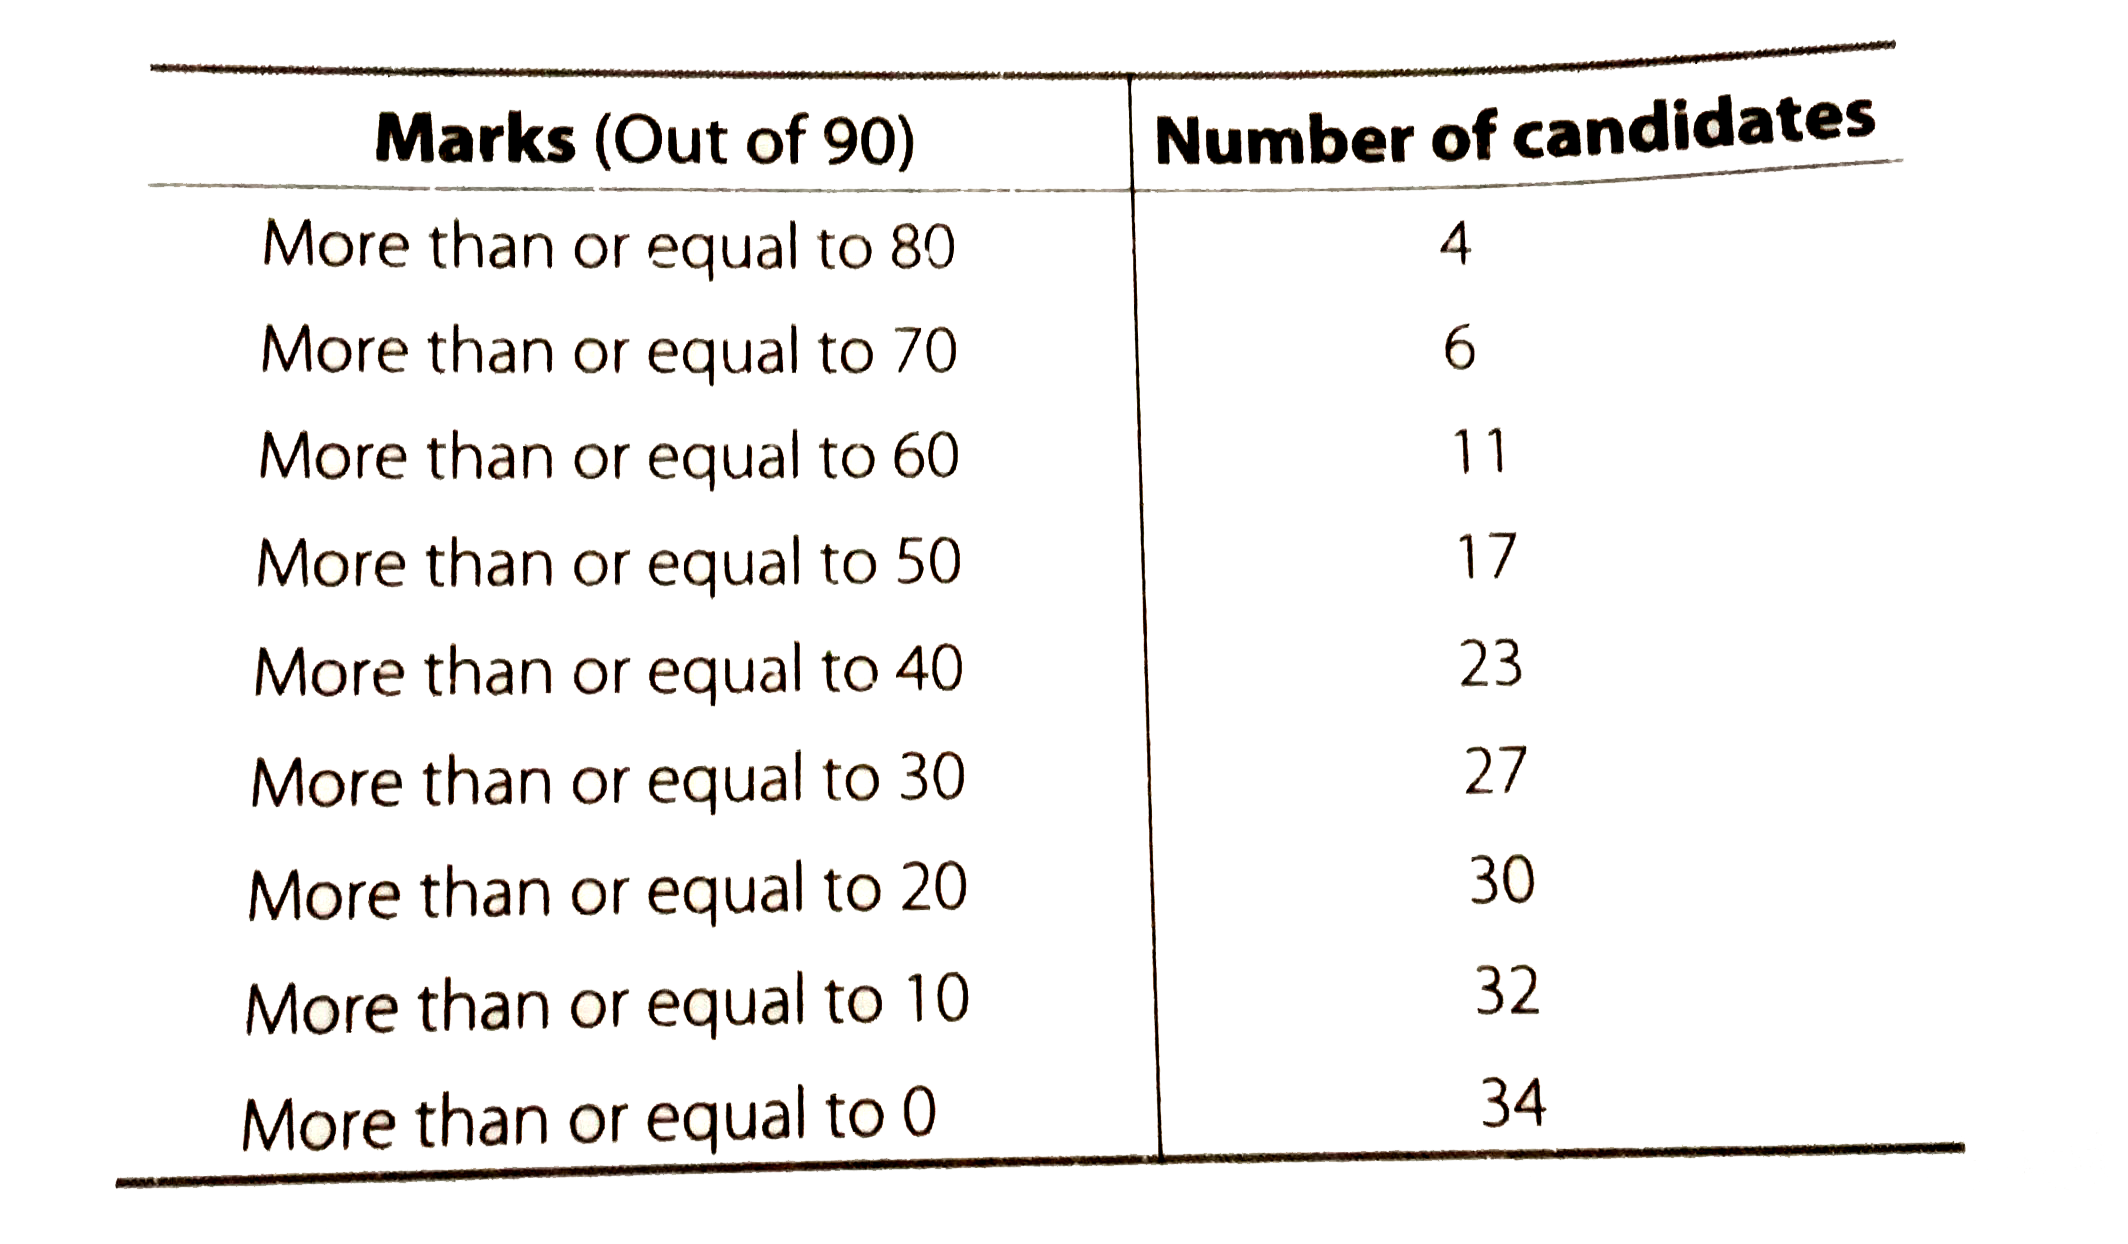
View SolutionThe following table gives the life times of 400 neon lamps:
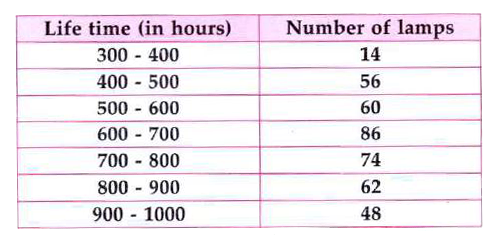
How many lamps have a life time of more than 700 hours?
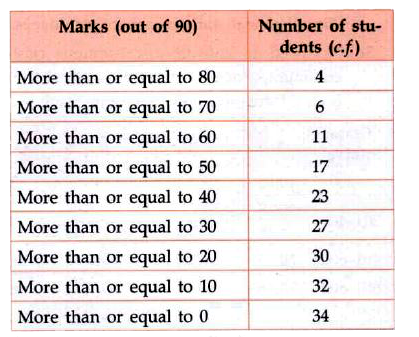
View SolutionForm the frequency distribution table from the following data:
Construct the frequency distribution table for the above data.
View SolutionDraw a frequency polygon for the following grouped frequency distribution table :

View SolutionThe following table gives the life times of 400 neon lamps:
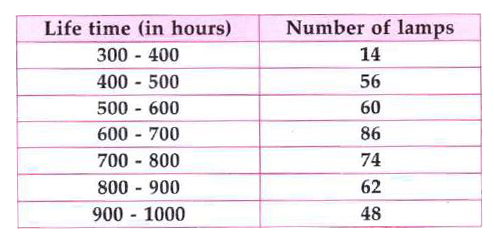
Represent the given information with the help of a histogram.
View SolutionThe following table gives the frequency distribution of life lergth in hours of 100 electric bulbs having median life 20 hours :
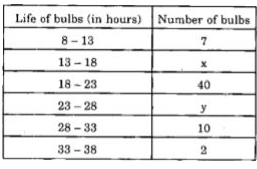
What is the missing frequency x ?
View SolutionThe following table gives the frequency distribution of life lergth in hours of 100 electric bulbs having median life 20 hours :
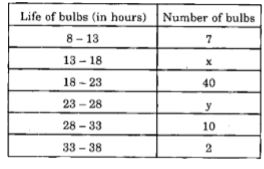
What is the missing frequency y ?
View SolutionThe following table gives the distribution of the life time of 400 neon lamps Find the median life of a lamp.
View Solution
