The following table gives the life times of 400 neon lamps:(i) Represent the given information with the help of histogram.(ii) How many lamps have a life time of more than 700 hours?
2) x=74+62+48 =184 lamps.
Similar Questions
The following table gives the life times of 400 neon lamps:
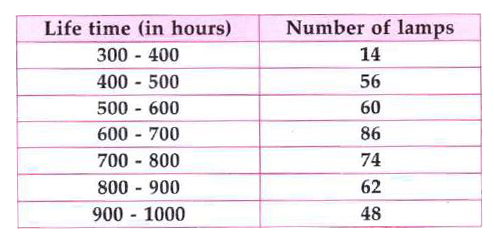
Represent the given information with the help of a histogram.
View SolutionThe following table gives the life times of 400 neon lamps:(i) Represent the given information with the help of histogram.(ii) How many lamps have a life time of more than 700 hours?
View SolutionThe following table gives the lifetimes of 400 neon lamps

(i) Represent the given information with the help of a histogram.
(ii) How many lamps have a lifetime of more 700 h?
View SolutionThe following table gives the life times of 400 neon lamps:
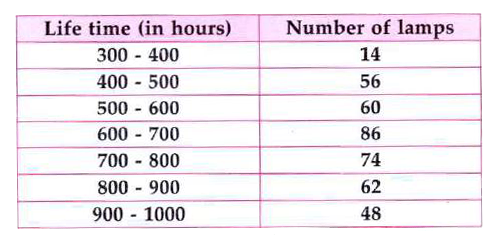
How many lamps have a life time of more than 700 hours?
View SolutionThe following table gives the distribution of the life time of 400 neon lamps Find the median life of a lamp.
View SolutionThe following pictograph depicts the information about the areas in sq km (to nearest hundred) of some districts of Chhattisgarh State:
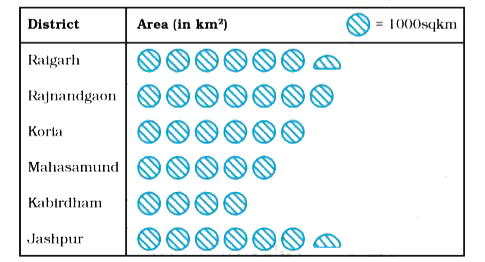
How many districts have area more than 5000 square kilometres?
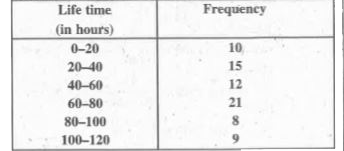
View SolutionThe following data gives the information on the life time (in hours ) of electrical instruments.
Find the mean of life time of the instruments
View SolutionThe following table gives the life time of 400 neon lamps: Life time (in hours 300-400 400-500 500-600 600-700 700-800 800-900 900-1000 No. of lamps: 14 56 60 86 74 62 48 A bulb is selected at random. Find the probability that the life time of the selected bulb is : less than 400 between 300 to 800 hours at least 700 hours.
View SolutionLook at the histogram given below answer the question that follow:
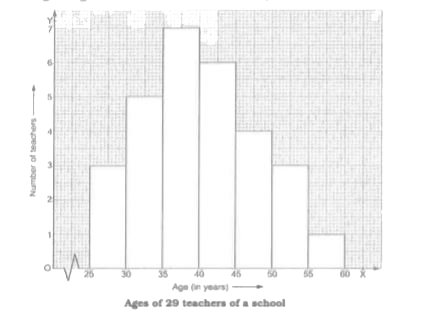
(i) What information in being given by the histogram?
(ii) How many teachers are of age less than 45 years?
(iii) How many teachers are of age 40 years or more but less than 55 years?
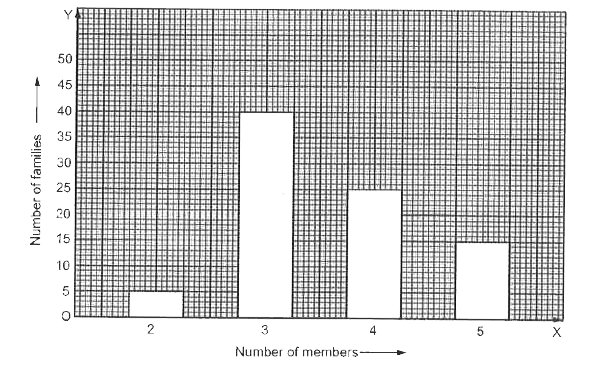
View SolutionIn a survey of 85 families of a colony, the number of members in each family was recorded and the data has been represented by the following bar graph
Read the bar graph carefully and answer the questions given below
Q (i) What information does the bar graph give
(ii) How many families have 3 members
(iii) How many people live alone
(iv) Which type of family is the most common? How many members are there in each family of this kind
View Solution
