Look at the histogram given below answer the question that follow:
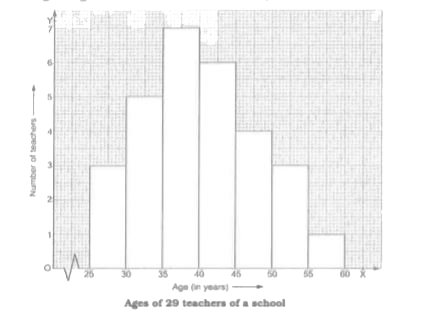
(i) What information in being given by the histogram?
(ii) How many teachers are of age less than 45 years?
(iii) How many teachers are of age 40 years or more but less than 55 years?
Step by step video & image solution for Look at the histogram given below answer the question that follow: (i) What information in being given by the histogram? (ii) How many teachers are of age less than 45 years? (iii) How many teachers are of age 40 years or more but less than 55 years? by Maths experts to help you in doubts & scoring excellent marks in Class 8 exams.
Updated on:21/07/2023Topper's Solved these Questions
- DATA HANDLING BOOK - RS AGGARWALCHAPTER - DATA HANDLING EXERCISE - Exercise 21B
6 Videos
- CUBES AND CUBE ROOTSBOOK - RS AGGARWALCHAPTER - CUBES AND CUBE ROOTSEXERCISE - Test Paper-4 (Fill in the blanks)
4 Videos
- DIRECT AND INVERSE PROPORTIONSBOOK - RS AGGARWALCHAPTER - DIRECT AND INVERSE PROPORTIONSEXERCISE - TEST PAPER -12 (Fill in the blanks )
5 Videos
Similar Questions
Look at the histogram below and answer the questions that follow.
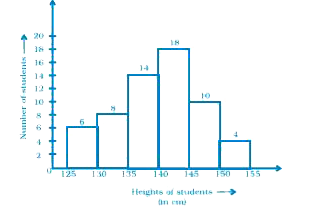
How many students have height less than 140 cm?
View SolutionLook at the histogram given below and answer the following questions.
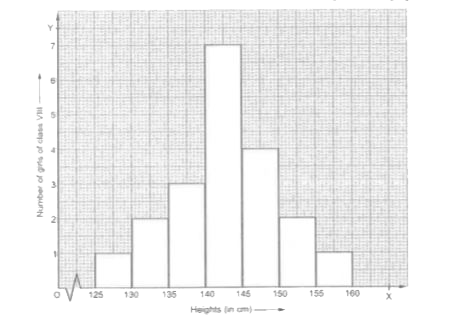
(i) What information in being given by the histogram?
(ii) Which group contains maximum girls?
(iii) How many girls have a height of 140 cm and more?
(iv) If we divide the girls into the following three categories, how many would there be in each?
150 cm and more - Group A
140 cm to less than 150 cm - Group B
Less than 140 cm-Group C
View Solution
Knowledge Check
In a school, the distribution of teachers is as follows:

The total number of teaches of age less than 40 years is:A10B12C39D18
Study the following graph and answer the question based on the graph.
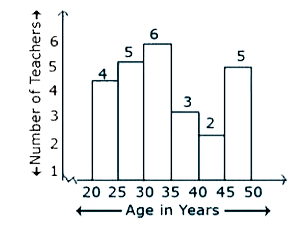
How many teachers are aged 45 years or more but less than 50 years?
View SolutionLook at the histogram below and answer the questions that follow.
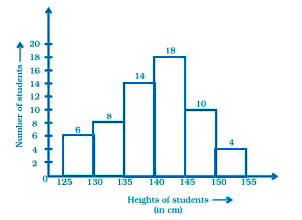
How many students have height more than or equal to 135 cm but less than 150 cm?
View SolutionStudy the following graph and answer the question based on the graph.
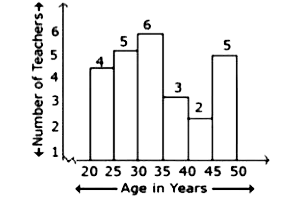
What percentage of the total number of teachers are aged less than 45 years?
View SolutionStudy the giiven graph and answer that follows
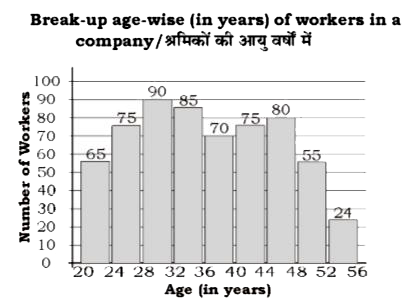
What is the ratio of the number of workers in the company whose age in 28 years or more but less than 40 years to the number of workers whose age is 40 years or more but less than 52 years.
View SolutionFollowing are the ages (in years) of 360 patients , getting medical treatment in a hospital :

One of the patients is selected at random
What is the probability that his age is
(i) 30 years or more but less than 40 years ?
(ii) 50 years or more but less than 70 years ?
(iii) 10 years or more but less than 40 years ?
(iv) 10 years or more ?
(v) less than 10 years ?
View SolutionIn the given histogram, what percentage of students got marks less than 45?
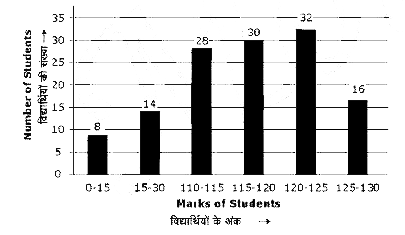
View SolutionStudy the given graph and answer the question that follows
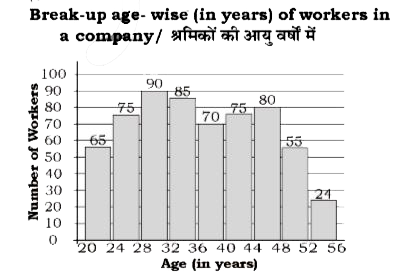
the number of workers whose age is 32 years or more but less than 44 years is:
View Solution
