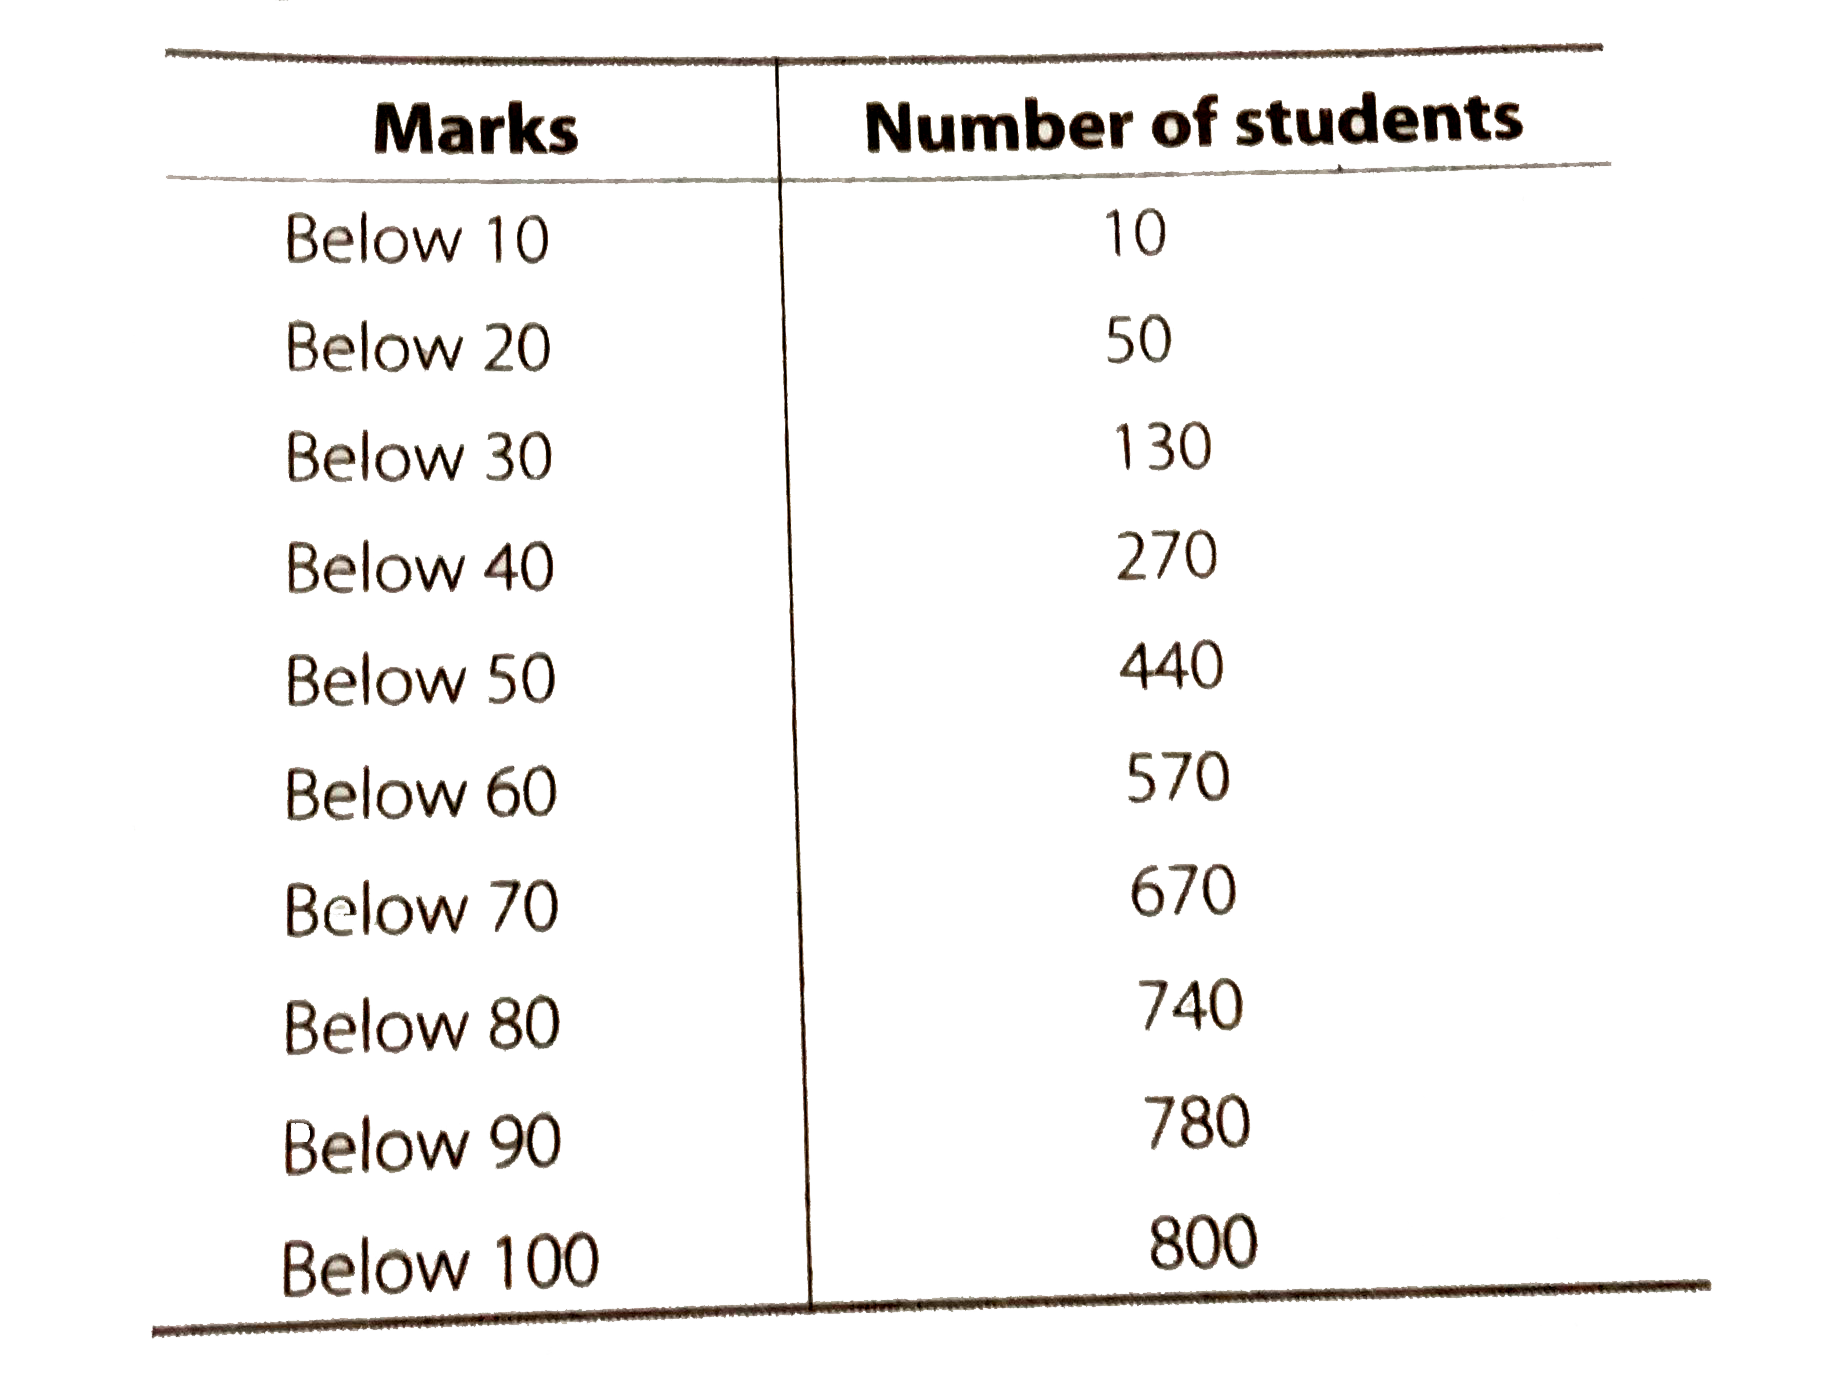
The following table show tha cumulative frequency distribution of marks of 800 students in an examination.

Construct a frequency distribution table for the data above.
Step by step video solution for The following table show tha cumulative frequency distribution of marks of 800 students in an examination. Construct a frequency distribution table for the data above. by Maths experts to help you in doubts & scoring excellent marks in Class 10 exams.
Updated on:21/07/2023Topper's Solved these Questions
- STATISTICSBOOK - OSWAL PUBLICATIONCHAPTER - STATISTICSEXERCISE - NCERT EXEMPLAR (Exercise - 13.4)
14 Videos
- STATISTICSBOOK - OSWAL PUBLICATIONCHAPTER - STATISTICSEXERCISE - BOARD CORNER (Short answer type questions)
5 Videos
- STATISTICSBOOK - OSWAL PUBLICATIONCHAPTER - STATISTICSEXERCISE - NCERT EXEMPLAR (Exercise - 13.2)
4 Videos
- SOME APPLICATIONS OF TRIGONOMETRY (HEIGHTS AND DISTANCES) BOOK - OSWAL PUBLICATIONCHAPTER - SOME APPLICATIONS OF TRIGONOMETRY (HEIGHTS AND DISTANCES) EXERCISE - CASE-BASED MCQs
15 Videos
- SURFACE AREAS AND VOLUMES BOOK - OSWAL PUBLICATIONCHAPTER - SURFACE AREAS AND VOLUMES EXERCISE - BOARD CORNER (LONG ANSWER TYPE QUESTIONS)
9 Videos
Similar Questions
Knowledge Check
In 'Less than' cumulative frequency distribution the omitted limit is
ALowerBUpperCMiddleDNone of theseA graph of a cumulative frequency distribution function is known as
AOgiveBHistogramCHistorigramDFrequency Polygon
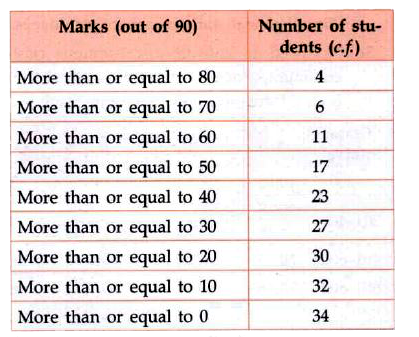
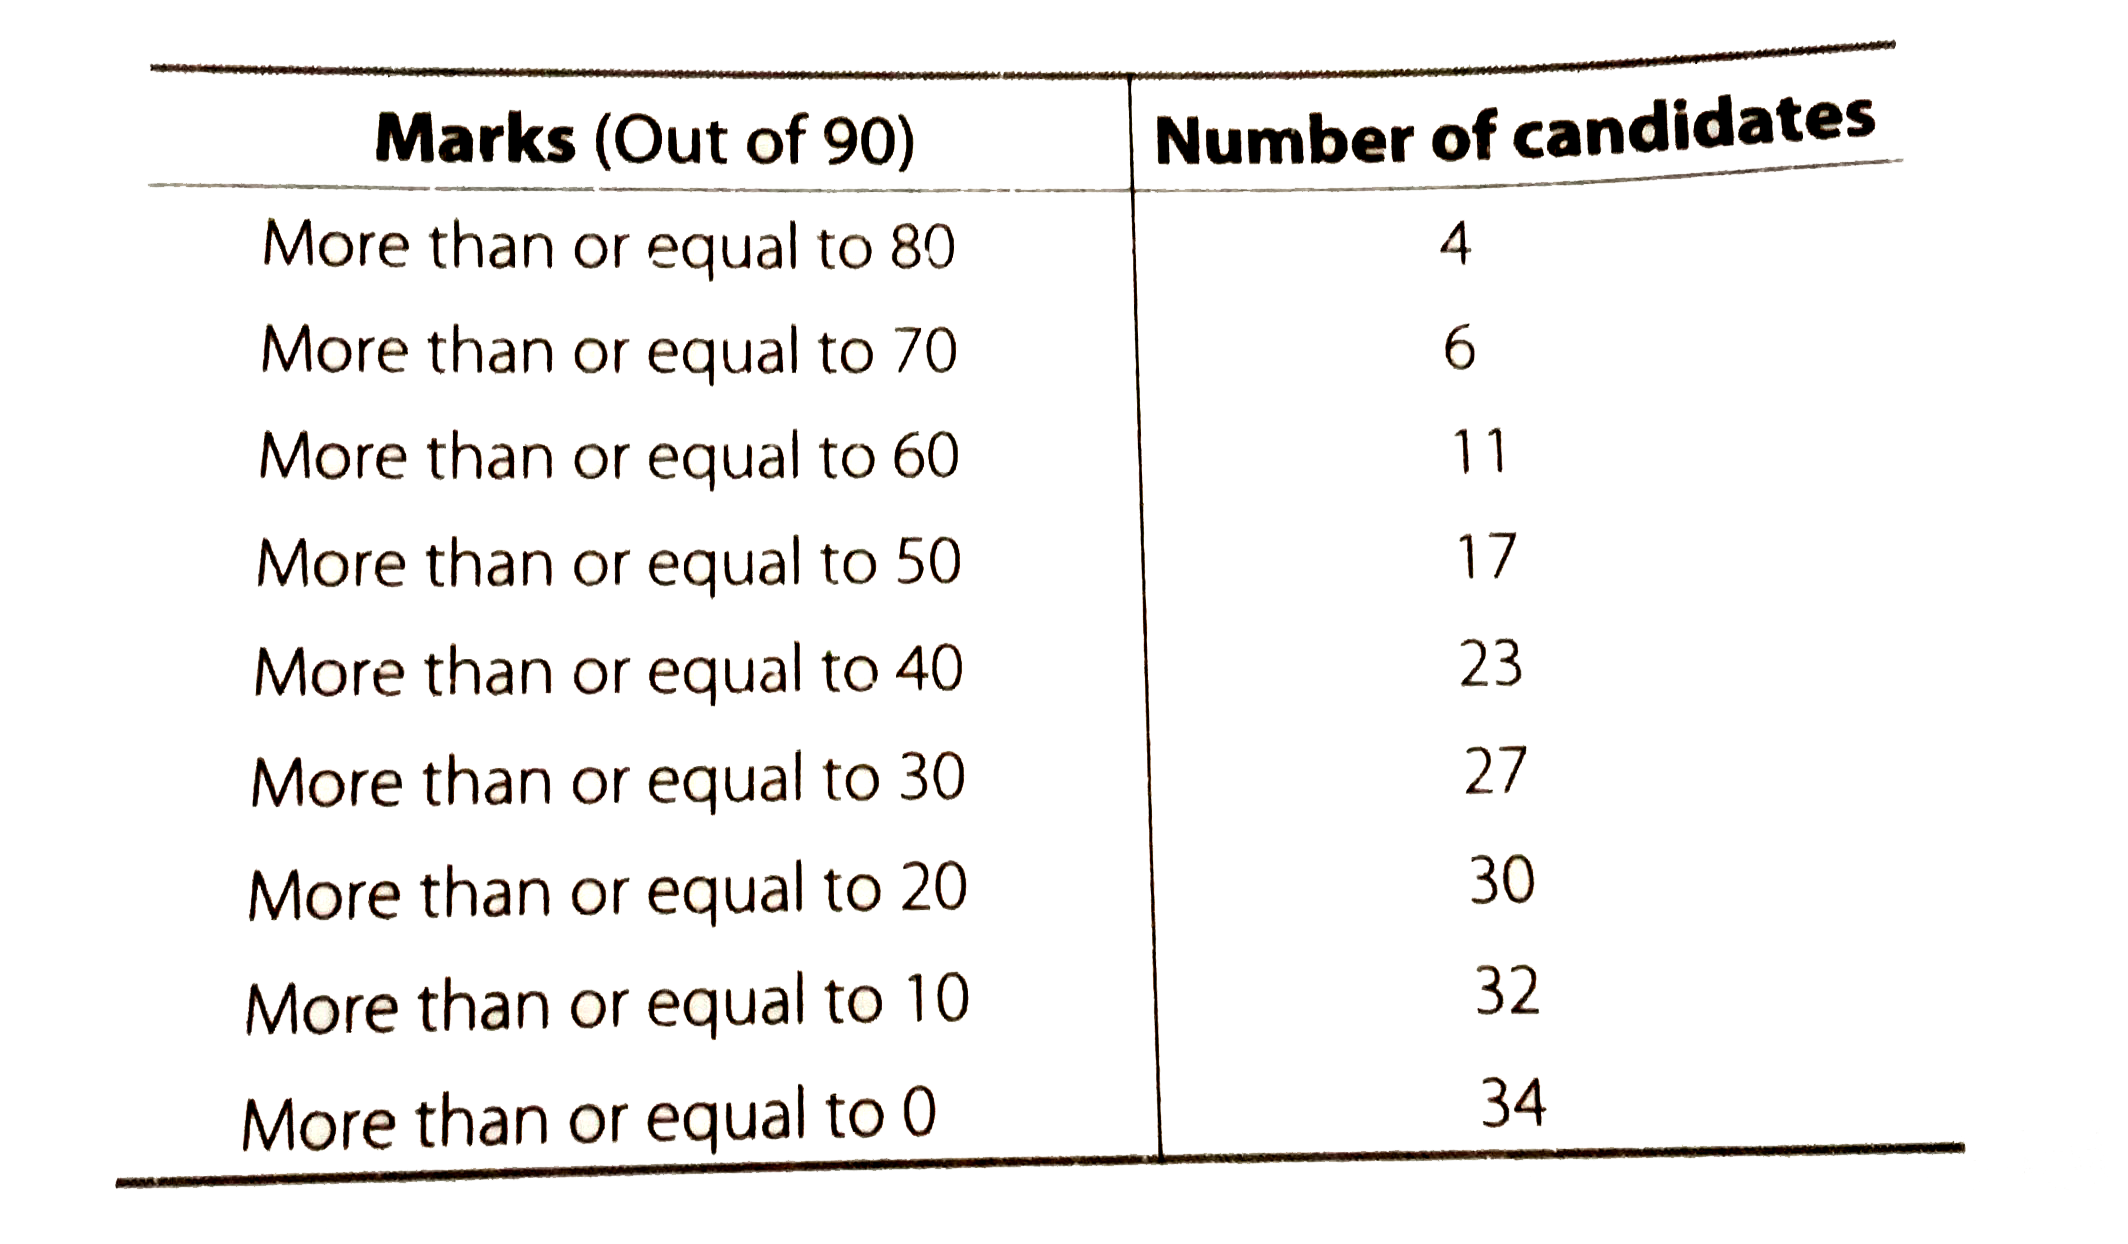
Given below is a cumulative frequency distribution showing the mars secured by 50 students of a class

From the frequency distribution table for the data.
View SolutionConstruction of Cumulative frequency distribution
View SolutionForm the frequency distribution table from the following data:
Construct the frequency distribution table for the above data.

View SolutionFrom the frequency distribution table from the following data

View SolutionConstruction of a Grouped frequency distribution
View SolutionThe following table shows frequency distribution of marks secured by 100 students in a particular examination. Find the mean of the marks.

View Solution
