Construction of a frequency distribution
Video Solution
|
Answer
Step by step video & image solution for Construction of a frequency distribution by Maths experts to help you in doubts & scoring excellent marks in Class 6 exams.
Updated on:21/07/2023Similar Questions
Knowledge Check
Which one of the following measures is determined only after the construction frequency distributions
AMeanBMedianCModeDNone of theseA Histogram is a graphical presentation of a frequency distribution of a:
Aindividual seriesBdiscrete seriesCcontinuous seriesDnone of these
For the frequency distribution

View SolutionFor the frequency distribution

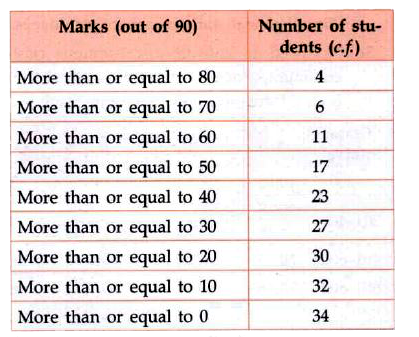
View SolutionForm the frequency distribution table from the following data:
Construct the frequency distribution table for the above data.

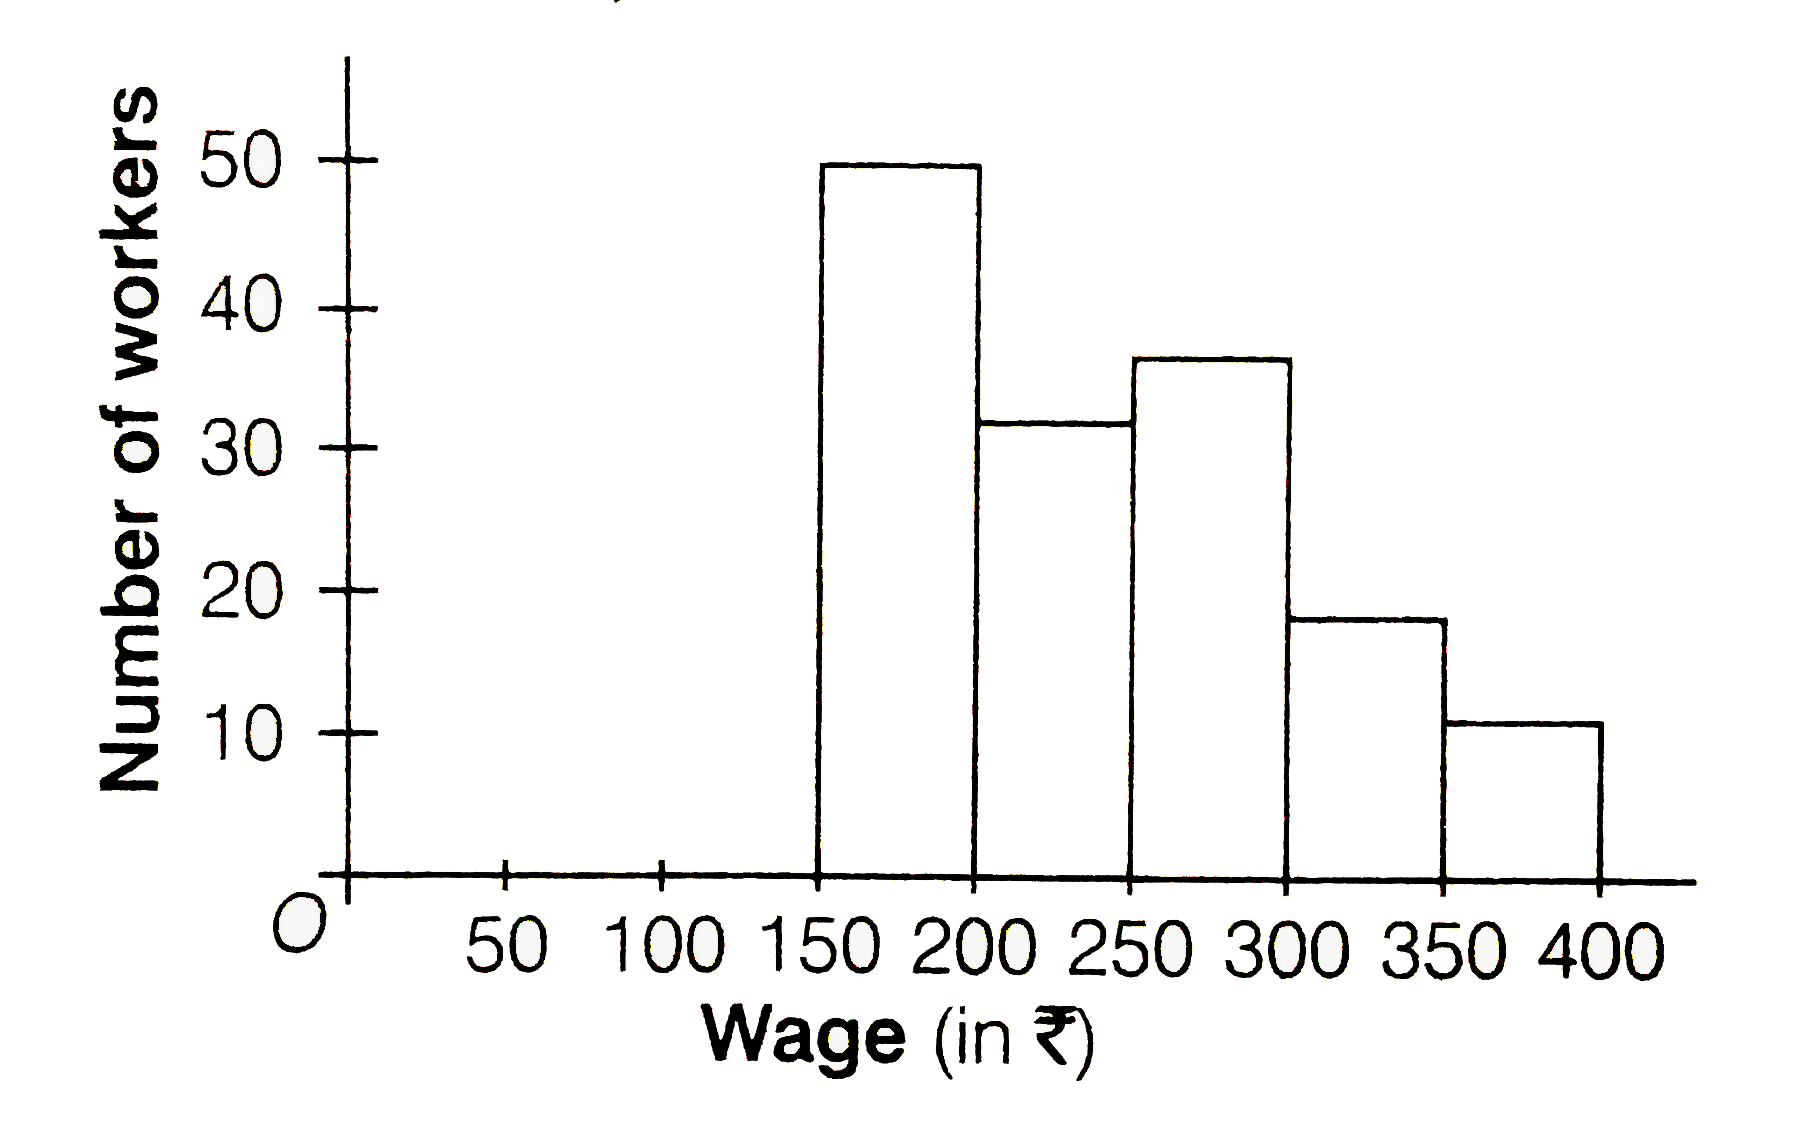
View SolutionIn the figure, there is histrogram depicting daily wages of workers in a factory. Construct the frequency distribution table.

View SolutionConstruction of a Grouped frequency distribution
View SolutionConstruct a grouped frequency distribution table with width 10 of each class, in such a way that one of the class is 10-20 (20 not included).
View Solution


