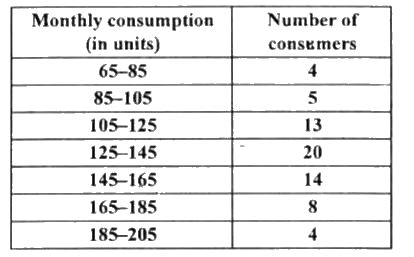
The following table shows the ages of the patients admitted in a hospital during a year:

Find the mode and the mean of the data given above. Compare and interpret the two measures of central tendency. Solution in Kannada
The correct Answer is:Mean =35.38
Step by step video, text & image solution for The following table shows the ages of the patients admitted in a hospital during a year: Find the mode and the mean of the data given above. Compare and interpret the two measures of central tendency. by Maths experts to help you in doubts & scoring excellent marks in Class 10 exams.
Topper's Solved these Questions
- BOOK - CPC CAMBRIDGE PUBLICATIONCHAPTER - STATISTICSEXERCISE - Exercise 13.37videos
STATISTICS
- BOOK - CPC CAMBRIDGE PUBLICATIONCHAPTER - STATISTICSEXERCISE - Exercise 13.44videos
STATISTICS
- BOOK - CPC CAMBRIDGE PUBLICATIONCHAPTER - STATISTICSEXERCISE - Exercise 13.44videos
STATISTICS
- BOOK - CPC CAMBRIDGE PUBLICATIONCHAPTER - SOME APPLICATIONS OF TRIGONOMETRYEXERCISE - EXERCISE 12.116videos
SOME APPLICATIONS OF TRIGONOMETRY
- BOOK - CPC CAMBRIDGE PUBLICATIONCHAPTER - SURFACE AREAS AND VOLUMES EXERCISE - EXERCISE 15.45videos
SURFACE AREAS AND VOLUMES
Similar Questions
The following frequency distribution gives the monthly consumption of electricity of 68 consumers of a locality. Find the median, mean and mode of the data and compare them.
 03:22View Solution
The following distribution gives the daily income of 50 workers of a factory.

Convert the distribution above to a less than type cumulative frequency distribution, and draw its ogive.01:37View SolutionThe following distribution gives the daily income of 50 workers of a factory.

Convert the distribution above to a less than type cumulative frequency distribution, and draw its ogive.02:11View SolutionA circus artist is climbing a 20m long rope, which is tightly stretched and tied from the top of a vertical pole to the ground.Find the height of the pole, if the angle made by the rope with the ground levelis 30∘ ( see Figure)
01:31View SolutionA drinking glass is in the shape of a frustum of a cone of height 14cm . The diameters of its two circular ends. are 4cm and 2cm . Find the capacity of the glass.
02:45View SolutionThe following table shows the ages of the patients admitted in a hospital during a year:Find the mode and the mean of the data given above. Compare and interpret the two measures of central tendency.
02:17View SolutionHow many lines of symmetry does the above figure have ?
05:41View SolutionDetermine the point of symmetry of a regular hexagon.
02:10View SolutionDtermine the images of the following figure about the given line :
02:17View SolutionMatch the following Column A to Column B
 02:10View Solution
Match the following Column A to Column B
 07:40View Solution
Match the following Column A to Column B
 05:16View Solution
The inequation represented by the graph given below is :
07:34View SolutionThe inequation that best describes the graph given below is _________
05:20View SolutionThe inequation that best describes the following graph is _________
03:21View Solutionनिम्नलिखित सारणी किसी अस्पताल में एक विशेष वर्ष में भर्ती हुए रोगियों की आयु को दर्शाती हैं :

उपरोक्त आँकड़ों से बहुलक ज्ञात कीजिए।View Solution

