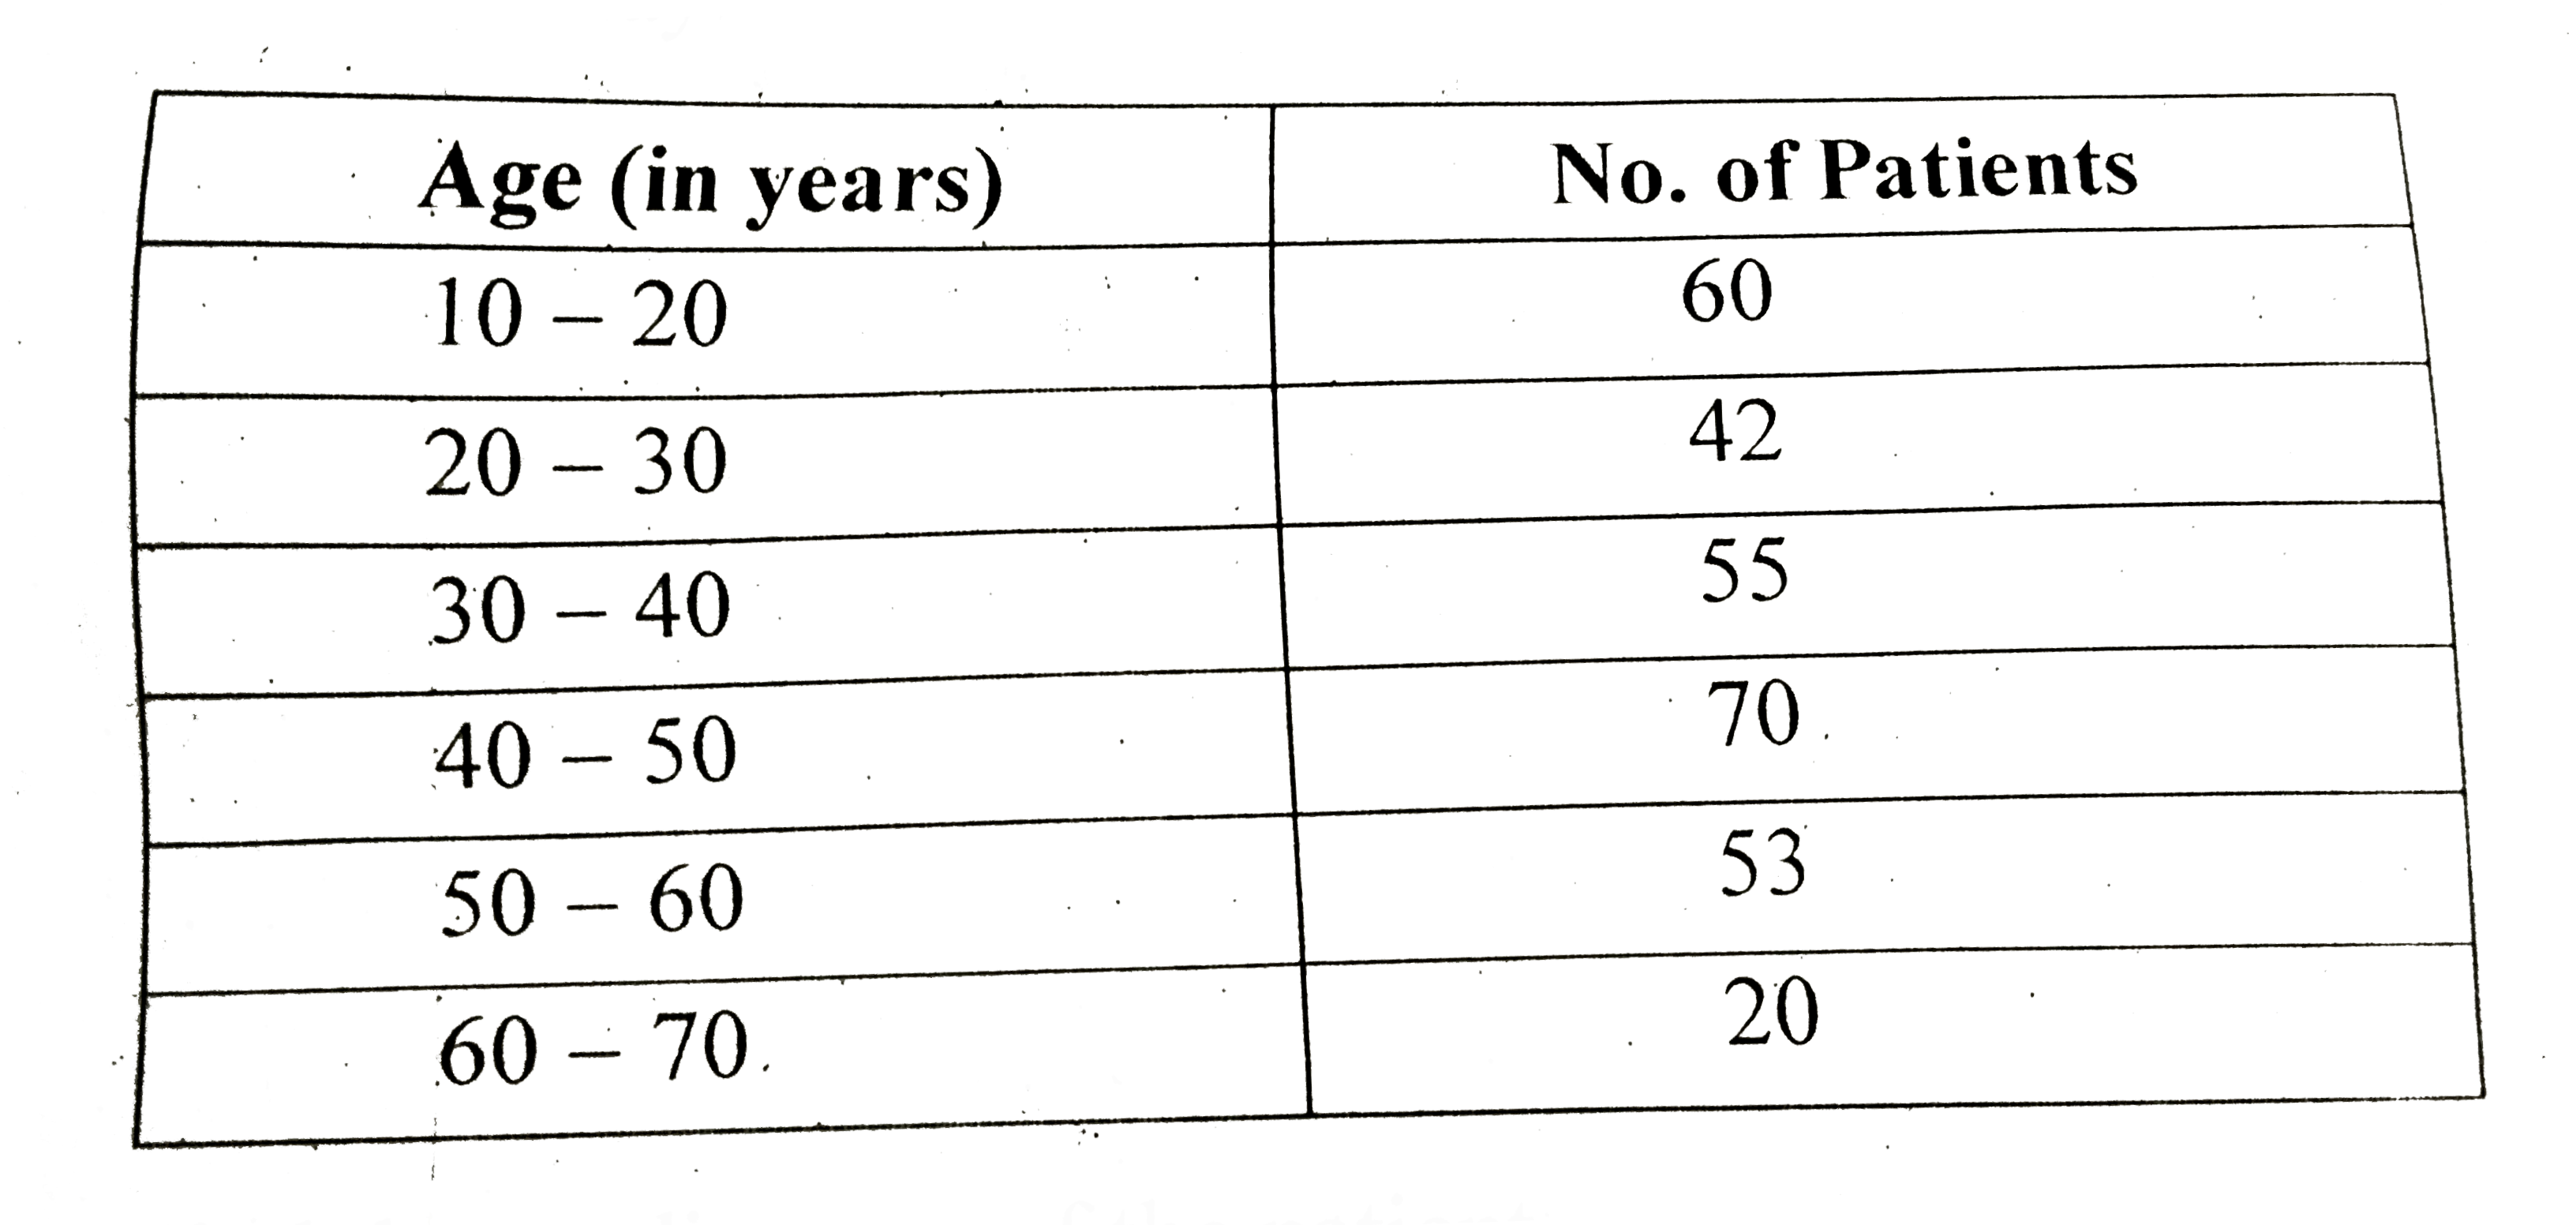
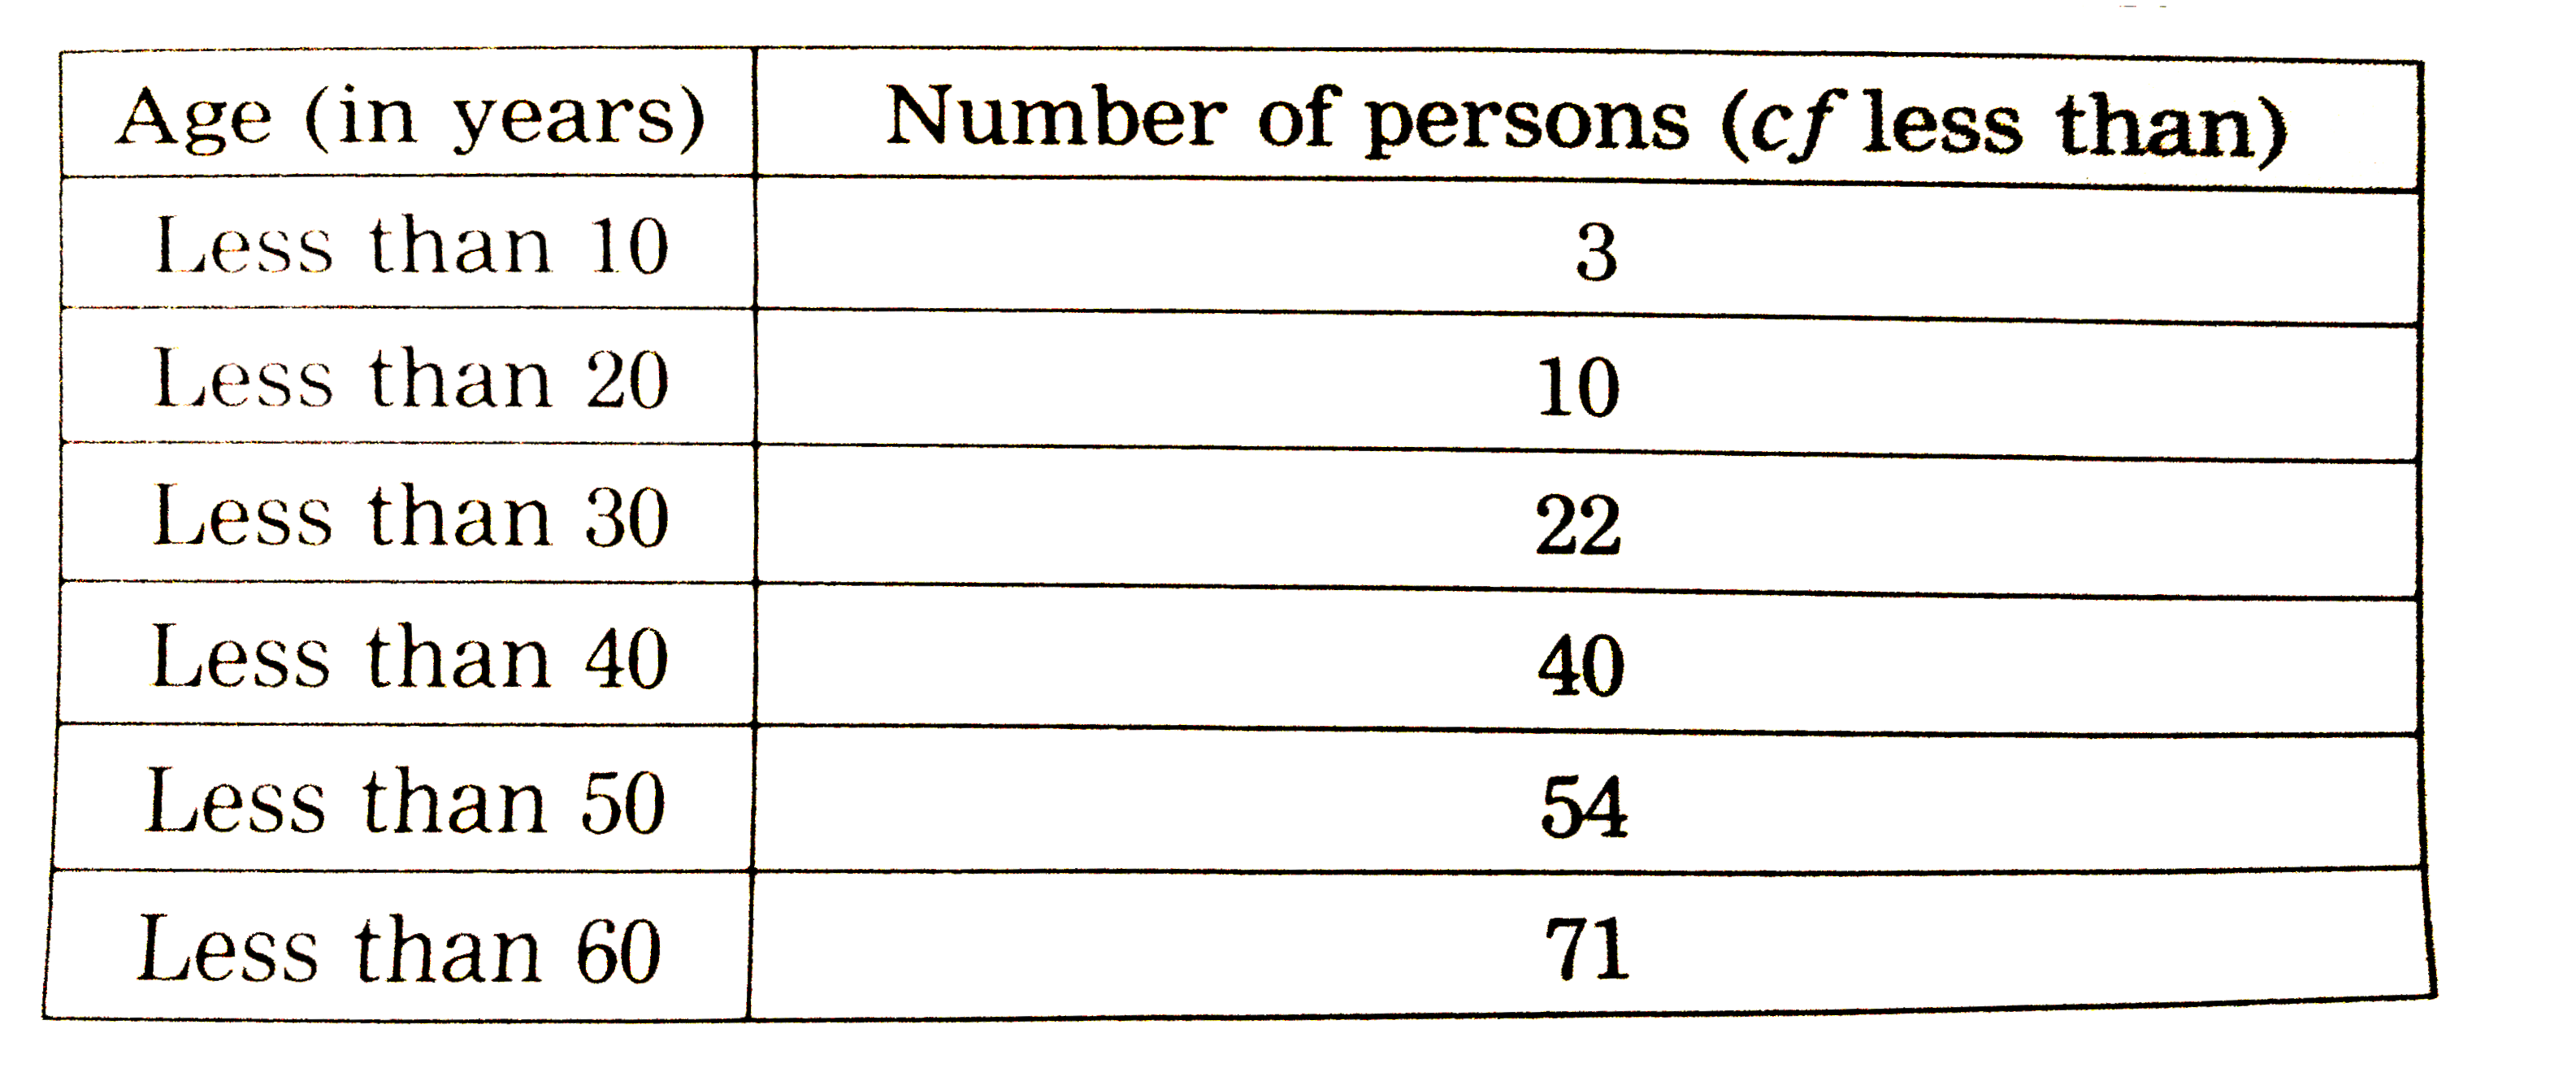
The following table shows the ages of the patients admitted in a hospital on a particular day :

Find the mode and the mean of the data given below. Compare and interpret the two measures of central tendency.
The correct Answer is:Mode = 36.8 years, Mean = 35.37 years, Maximum number of patients admitted in the hospital are of the age 36.8 years (approx.), while on an average the age of a patient admitted to the hospital is 35.37 years
Topper's Solved these Questions
- STATISTICSBOOK - NCERT GUJARATICHAPTER - STATISTICSEXERCISE - Exercise 14.3
7 Videos
- STATISTICSBOOK - NCERT GUJARATICHAPTER - STATISTICSEXERCISE - Exercise 14.4
3 Videos
- STATISTICSBOOK - NCERT GUJARATICHAPTER - STATISTICSEXERCISE - Exercise 14.1
9 Videos
- SIMILAR TRIANGLES BOOK - NCERT GUJARATICHAPTER - SIMILAR TRIANGLES EXERCISE - TRY THIS
6 Videos
- TANGENTS AND SECANTS TO A CIRCLEBOOK - NCERT GUJARATICHAPTER - TANGENTS AND SECANTS TO A CIRCLEEXERCISE - Try this
2 Videos
Similar Questions
The following table shows the ages of the patients admitted in a hospital during a year:Find the mode and the mean of the data given above. Compare and interpret the two measures of central tendency.
View SolutionThe following table shows the ages of the patients admitted in a hospital during a year:Find the mode and the mean of the data given above. Compare and interpret the two measures of central tendency.
View SolutionThe following table shows ages of 300 patients getting medical treatment in a hospital on a particular day:

Find the median age of the patient.
View SolutionThe following table shows ages of people who went to a particular play of circus in a day.

Find the mode of the ages of the vistiors.
View SolutionThe following table shows the ages of persons who visited a museum on a certain day. Find the median age of the visitors.

View SolutionThe following frequency distribution table gives the ages of 200 patients treated in a hospital in a weak. Find the mode of ages of the patients.

View SolutionFind the mean of the data given in the following table :

View SolutionThe following frequency dsitribution table gives the ages of 80 patients treated in a hospital during a month. Find the mode of the ages of the patients.

View SolutionThe following frequency distribution table gives the ages of 200 patients treated in a hospital in a week. Find the mode of ages of the patients.

View SolutionThe following table shows the number of patients of differents age groups admitted to a hospital for treatement on a day. Find the median age of the patients.

View Solution
